Figure 3.

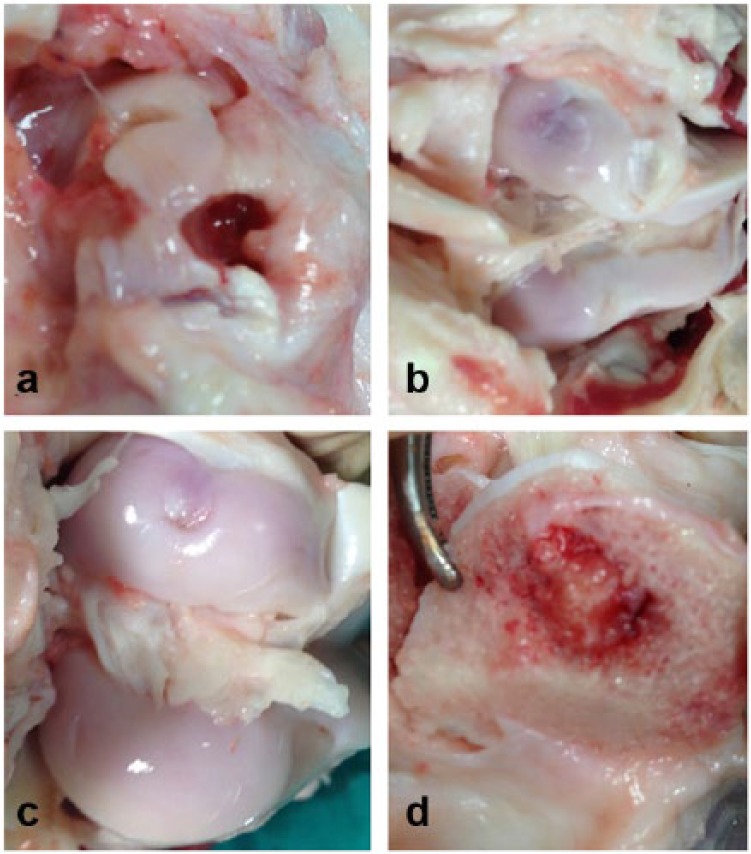
A macroscopic analysis image of the defect sites at 6 months in (a) the control, (b) Group A, and (c) Group B animals, respectively, and (d) the bone side.

A macroscopic analysis image of the defect sites at 6 months in (a) the control, (b) Group A, and (c) Group B animals, respectively, and (d) the bone side.