
Table 1: Mean scores and standard deviation obtained in the questionnaires, in the evaluation of anatomy and postural habits sections, and overall score in post-test and follow-up periods (n=38).
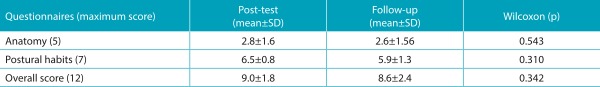
SD: standard deviation.
Official websites use .gov
A
.gov website belongs to an official
government organization in the United States.
Secure .gov websites use HTTPS
A lock (
) or https:// means you've safely
connected to the .gov website. Share sensitive
information only on official, secure websites.
SD: standard deviation.