. 2017 Jun 2;6:e24437. doi: 10.7554/eLife.24437

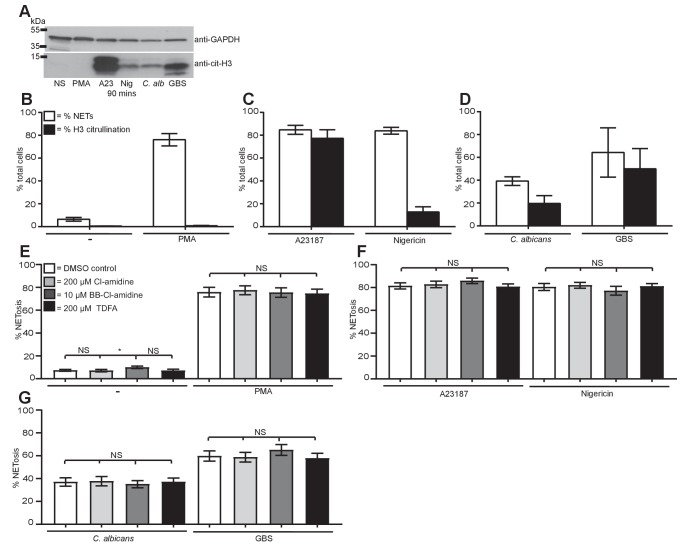
Figure 6. Citrullination of histone H3 occurs during NETosis but is not required for NET induction.

(A–D) Histone H3 was citrullinated during NETosis in response to all stimuli bar PMA. (A) Primary neutrophils were stimulated for 90 min with PMA, A23187, nigericin, C. albicans or GBS, lysed and assayed for the presence of citrullinated histone H3 and GAPDH by SDS-PAGE electrophoresis and Western immunoblotting. (B–D) NETosis rate and percentage of citrullinated cells in response to (B) PMA, (C) A23187 or nigericin and (D) C. albicans or GBS. Graphs show mean ± SD from a representative of two independent experiments. (E–G) NETosis rate in neutrophils pre-treated with the PAD inhibitor Cl-amidine at 200 µM, BB-Cl-amidine at 10 µM, TDFA at 200 µM, or DMSO as control and stimulated with (E) PMA, (F) A23187 or nigericin and (G) C. albicans or GBS and analysed for NET production by immunofluorescence. Graphs show mean ± SEM from 10 independent experiments. *p<0.05, NS = not significant.

DOI: http://dx.doi.org/10.7554/eLife.24437.022

Figure 6—source data 1. This data is the mean of ten independent NETosis assays in response to the five stimuli of interest in the presence of the PAD inhibitors and was used to generate the histograms in Figure 6.
DOI: 10.7554/eLife.24437.023

Figure 6.

Figure 6—figure supplement 1. PAD inhibitors reduce histone H3 citrullination.

Figure 6—figure supplement 1.

Neutrophils were pre-treated with (A) 200 µM Cl-amidine, (B) 10 µM BB-Cl-amidine or (C) 200 µM TDFA, stimulated with A23187, C. albicans or GBS for 3–4 hr, fixed, stained with an antibody against citrullinated histone H3 and hoechst and analysed for percentage of cells citrullinated on histone H3 by immunofluorescence. Graphs show mean ± SEM from three independent experiments.
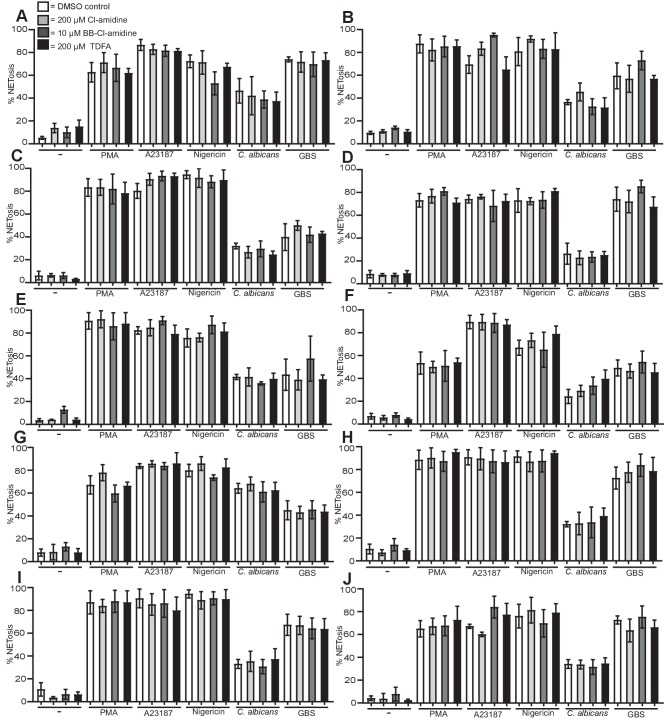
Figure 6—figure supplement 2. PAD inhibitors do not prevent NETosis.

Figure 6—figure supplement 2.

(A–J) Neutrophils were pre-treated with Cl-amidine at 200 µM (light grey bars), BB-Cl-amidine at 10 µM (dark grey bars), TDFA (black bars) at 200 µM, or DMSO as control (white bars), stimulated with PMA, A23187, nigericin, C. albicans or GBS for 2.5–4 hr and analysed for NET production by immunofluorescence. Graphs show mean ± SD from 10 independent experiments.