
Figure 7. Silencing of exophilin-8 or RIM-BP2 decreases the cell-corner localization and exocytosis of insulin granules.
(A) INS-1 832/13 cells were transfected with control siRNA duplexes, or siRNA duplexes against exophilin-8 or RIM-BP2. The cell extracts were immunoblotted with anti- RIM-BP2, anti-exophilin-8, and anti-β-actin antibodies. (B) INS-1 832/13 cells treated with siRNA as shown in (A) were incubated for 2 hr in KRB buffer containing 2.8 mM glucose, and were then stimulated for 60 min in the same buffer (gray bars) or buffer containing 25 mM glucose (black bars). The ratios of insulin secreted into the medium to that remaining in the cells were normalized to those found in control cells stimulated by 25 mM glucose. (C–E) The cells treated with siRNA were immunostained with anti-insulin antibody and either anti-RIM-BP2 (D) or anti-exophilin-8 (E) antibodies. In each experiment, a total of 100 cells were visually inspected, and the fraction of cells exhibiting a higher granule density in at least one cell corner or extension than in the cell center was manually counted (C). Bars, 10 μm. (F, G) INS-1 832/13 cells treated with control siRNA or siRNA against RIM-BP2 were infected with adenovirus encoding control GFP, or wild-type or ΔSH3 MEF-RIM-BP2, as shown in Figure 7—figure supplement 2. They were subjected to insulin secretion assays (F) as in (B), or were immunostained with anti-insulin antibody to examine granule localization (G) as in (C). All quantitative data are means ± SD (n = 5 for B, and n = 4 for C, and n = 3 for F). *p values calculated using two-tailed unpaired t-test are as follows: (B) 1.9 × 10⁻⁷ (si Exophilin-8), 7.3 × 10⁻⁶ (si RIM-BP2) vs si Control, (C) 0.00010 (si Exophilin-8), 0.00025 (si RIM-BP2) vs si Control, (F) 3.7 × 10⁻³ (si RIM-BP2, GFP), 8.2 × 10⁻³ (si RIM-BP2, MEF-RIM-BP2) vs si Control, GFP, and 0.033 (si RIM-BP2, GFP), 0.060 (si RIM-BP2, MEF-RIM-BP2ΔSH3; marked by #) vs si RIM-BP2, MEF-RIM-BP2, and (G) 1.1 × 10⁻³ (si RIM-BP2, GFP), 5.5 × 10⁻³ (si RIM-BP2, MEF-RIM-BP2) vs si Control, GFP, and 7.7 × 10⁻³ (si RIM-BP2, GFP), 7.1 × 10⁻⁵ (si RIM-BP2, MEF-RIM-BP2ΔSH3) vs si RIM-BP2, MEF-RIM-BP2.

Figure 7—figure supplement 1. More images of INS-1 832/13 cells treated with siRNA.

Figure 7—figure supplement 2. Expression levels of endogenous and exogenous RIM-BP2.
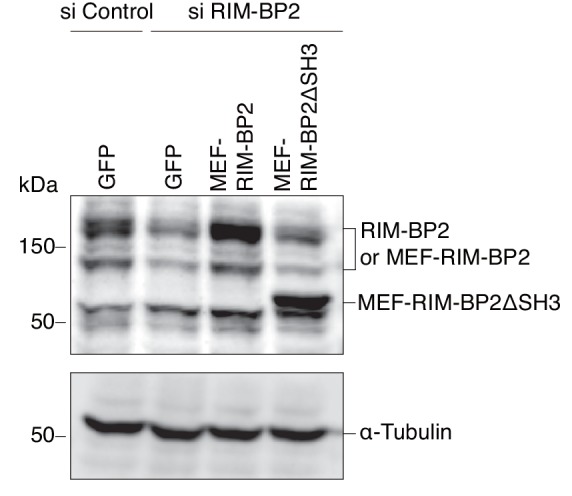
Figure 7—figure supplement 3. Granule localization in INS-1 832/13 cells treated with siRNA against RIM-BP2 and then expressing wild-type or ΔSH3 RIM-BP2.
