. 2017 Jul 4;6:e18459. doi: 10.7554/eLife.18459

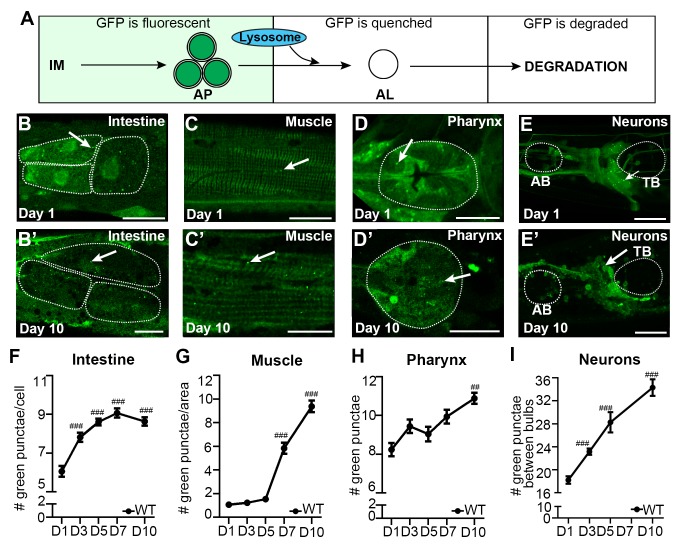
Figure 1. The autophagosome pool size increases with age in C. elegans.

(A) Schematic representation of GFP::LGG-1 fluorescence states in the autophagy pathway. IM, isolation membrane; AP, autophagosome; AL, autolysosome. (B–E’) Adult transgenic WT animals expressing gfp::lgg-1, imaged at Day 1 (B–E) and Day 10 (B’–E’) of adulthood. APs (arrows) can be seen in the intestine (B,B’), body-wall muscle (C,C’), pharynx (D,D’), and nerve-ring neurons (E,E’). Dotted lines outline individual intestinal cells (B,B’) and pharyngeal bulbs (D–E’). AB, anterior pharyngeal bulb; TB, terminal pharyngeal bulb. Scale bars = 20 µm. (F–I) Quantification of autophagosomes (AP; GFP punctae) in the intestine (F), body-wall muscle (G), pharynx (H), and nerve-ring neurons (I) at Days 1, 3, 5, 7, or 10 of adulthood in WT animals. Day 7 was omitted for neurons due to a counting issue at this time point. Data are the mean ± SEM of ≥20 animals combined from three independent experiments per time point. ###p<0.00 and ##p<0.001 for WT control at Day 1, 3, 5, 7, or 10 vs. WT control at Day 1 by Poisson regression.

DOI: http://dx.doi.org/10.7554/eLife.18459.002

Figure 1.

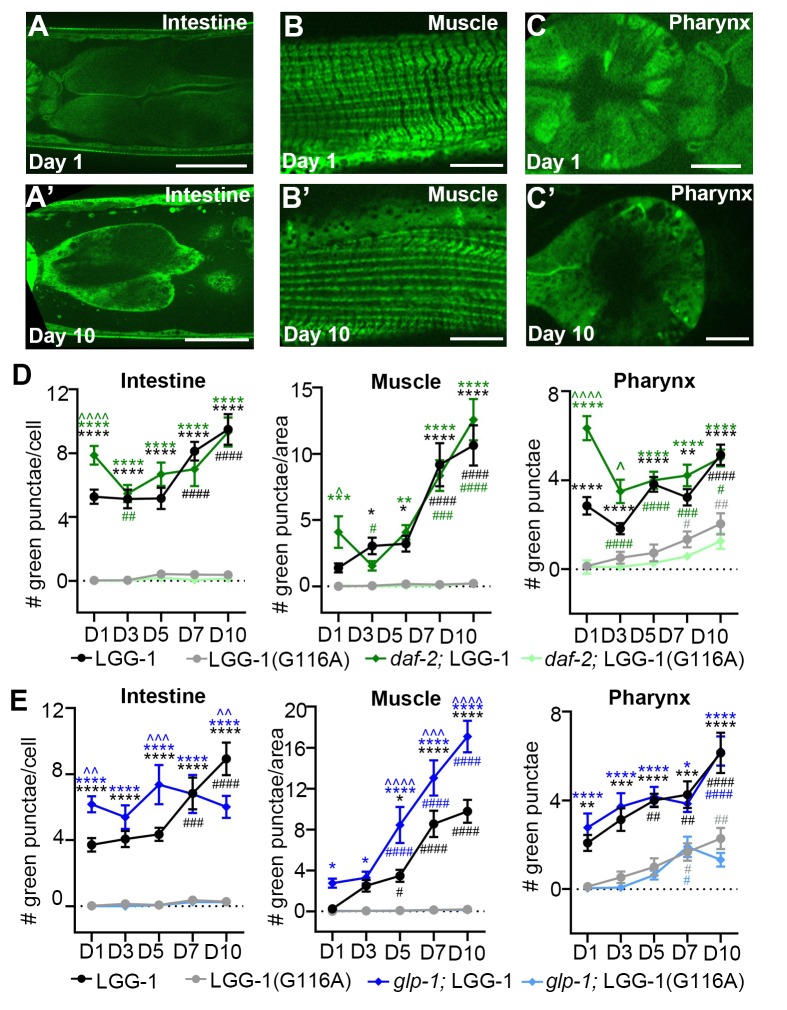
Figure 1—figure supplement 1. Age-related increase in autophagosome pool size requires lipidation of LGG-1.

Figure 1—figure supplement 1.

(A–C) Adult transgenic wild-type (WT) animals expressing gfp::lgg-1(G116A) imaged at Day 1 (A–C) and 10 (A’–C’) of adulthood in the intestine (A), body-wall muscle (B) and pharynx (C). Scale bars = 150 µm (A), 20 µm (B) and 50 μM (C). (D–E) Quantification of GFP-positive punctae in the intestine, body-wall muscle, and pharynx of WT or daf-2(e1370) animals expressing either gfp::lgg-1 (LGG-1) or gfp::lgg-1(G116A) (LGG-1(G116A)) and raised at 20°C (D), or WT or glp-1(e2141) animals expressing either gfp::lgg-1 or gfp::lgg-1(G116A) (E) and raised at 25°C until Day 1 of adulthood and then grown at 20°C for remainder of life. Data are the mean ± SEM of combined from two independent experiments per time point with ≥20 animals total. Two additional repeats of WT animals showed similar results (data not shown). , WT + control vs. glp-1/daf-2 control at Days 1, 3, 5, 7, and 10; *, glp-1/daf-2 control vs. WT/glp-1/daf-2 + BafA at Days 1, 3, 5, 7, and 10, #, WT/glp-1/daf-2 control at Days 3, 5, 7, and 10 vs. WT/glp-1/daf-2 control at Day 1. ***/∧∧∧/###p<0.0001, **/∧∧/##p<0.001, *//#p<0.01 by two-way ANOVA. We note that the pharyngeal counts in WT animals were lower in these experiments compared to others (Figures 35 and Figure 4—figure supplement 1); this may be due to the use of different microscopes, strains, and/or experimenters. We note that we also assessed the number of GFP-positive punctae between and near the pharyngeal bulbs to possibly evaluate neurons; however, while we observed very few punctae in this area in animals expressing GFP::LGG-1(G116A) (data not shown), none of the LGG-1 reporters expressed from the endogenous promoter allowed for accurate cell identification, and neurons therefore remain to be fully evaluated.