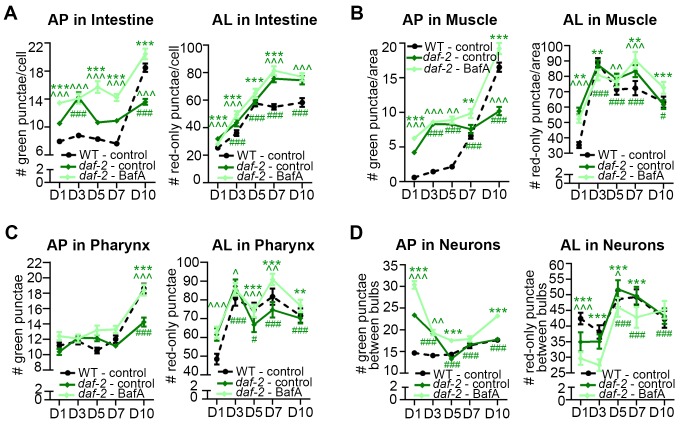
Figure 4. daf-2 insulin/IGF-1 receptor mutants display increased autophagic activity in most tissues.
(A–D) Quantification of autophagosomes (AP) and autolysosomes (AL) in adult Day 1, 3, 5, 7, and 10 daf-2(e1370) animals expressing mCherry::gfp::lgg-1 and injected with DMSO (control, dark green lines) or Bafilomycin A (BafA, light green lines). Tissues examined were the intestine (A), body-wall muscle (B), pharynx (C), and nerve-ring neurons (D). The black dashed lines in (A–C) show data from wild-type (WT) control animals from Figure 3 for comparison (animals were analyzed in parallel). The black dashed line in (D) shows data from WT animals incubated at 20°C for their entire lifespan. Data are the mean ± SEM of ≥25 animals combined from three independent experiments. ∧, WT control vs. daf-2 control at Days 1, 3, 5, 7, and 10; *, daf-2 control vs. daf-2 + BafA at Days 1, 3, 5, 7, and 10; #, daf-2 control at Days 3, 5, 7, and 10 vs. daf-2 control at Day 1. ***/∧∧∧/###p<0.0001, **/∧∧/##p<0.001, */∧/#p<0.01 by Poisson regression. See also Figure 3—figure supplement 1A–H for quantification of APs in gfp::lgg-1 transgenic animals.


