. 2017 Jul 4;6:e18459. doi: 10.7554/eLife.18459

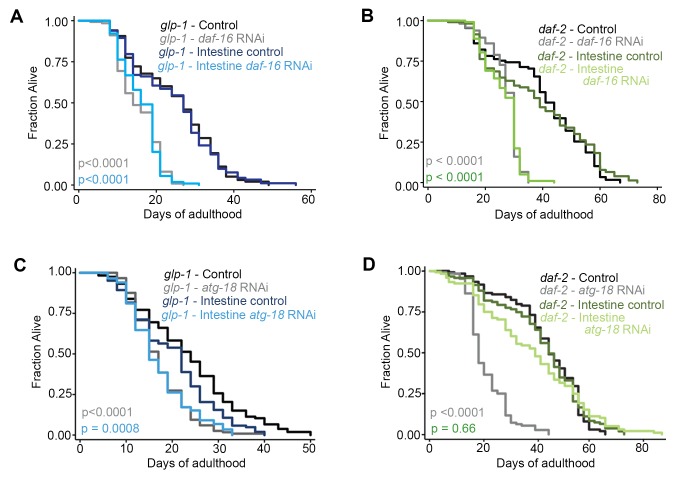
Figure 6. Autophagy genes expressed in intestinal cells are required for lifespan extension of glp-1 mutants, but not of daf-2 mutants.

(A,C) Kaplan–Meier survival curves of glp-1(e2141) single mutants and glp-1(e2141); sid-1(qt9) double mutants expressing sid-1 cDNA in the intestine (vha-6 promoter). Animals were fed from Day 1 of adulthood with bacteria expressing empty vector (control), daf-16/Foxo dsRNA (A), or atg-18/Wipi dsRNA (C). Intestine-specific inhibition of daf-16/Foxo shortened the lifespan of glp-1(e2141) mutants in two out of two experiments ach with ≥100 animals. p<0.0001 for whole body control RNAi vs. whole body daf-16/Foxo RNAi; p<0.0001 for intestine-specific control RNAi vs. intestine-specific daf-16 RNAi by log-rank test. Intestine-specific inhibition of atg-18/Wipi shortened the lifespan of glp-1(e2141) mutants in five out of seven experiments, each with ≥100 animals. p<0.0001 for whole-body control RNAi vs. whole-body atg-18/Wipi RNAi; p=0.0008 for intestine-specific control RNAi vs. intestine-specific atg-18/Wipi RNAi by log-rank test. (B,D) Kaplan–Meier survival curves of daf-2(e1370) single mutants and daf-2(e1370); sid-1(qt9) double mutants expressing sid-1 cDNA in the intestine (vha-6 promoter). Animals were fed from Day 1 of adulthood with bacteria expressing empty vector (control), daf-16/Foxo dsRNA (B), or atg-18/Wipi dsRNA (D). Intestine-specific inhibition of daf-16/Foxo shortened the lifespan of daf-2(e1370) mutants in two out of two experiments, each with ≥100 animals. p<0.0001 for whole body control RNAi vs. whole body daf-16/Foxo RNAi; p<0.0001 for intestine-specific control RNAi vs. intestine-specific daf-16 RNAi by log-rank test. Intestine-specific inhibition of atg-18/Wipi had no significant effect on the lifespan of daf-2(e1370) mutants in all of six experiments, each with ≥100 animals. p<0.0001 for whole-body control RNAi vs. whole-body atg-18/Wipi RNAi; p=0.66 for intestine-specific control RNAi vs. intestine-specific atg-18/Wipi RNAi, by log-rank test. See Supplementary file 1 for details on lifespan analyses and additional repeats.

DOI: http://dx.doi.org/10.7554/eLife.18459.016

Figure 6.

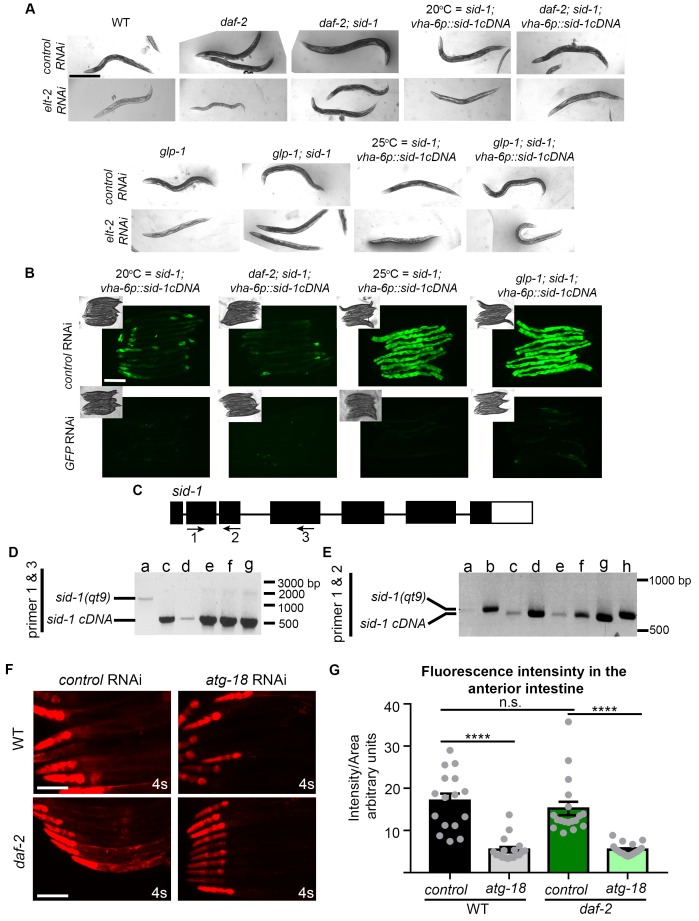
Figure 6—figure supplement 1. Characterization of intestinal RNAi strains.

Figure 6—figure supplement 1.

(A) Differential interference contrast (DIC) images of Day 3 adult wild-type (WT, (N2), daf-2 (e1370), daf-2(e1370); sid-1(qt9), sid-1(qt9); vha-6p::sid-1cDNA, daf-2(e1370); sid-1(qt9); vha-6p::sid-1cDNA, glp-1(e2141), glp-1(e2141); sid-1(qt9), and glp-1(e2141); sid-1(qt9); vha-6p::sid-1cDNA animals fed from hatching with bacteria containing empty vector (control) or elt-2 dsRNA (elt-2i). Similar results were obtained with animals subjected to pept-1 RNAi, whereas no response was obtained following RNAi knockdown of the muscle-specific gene, unc-112, and hypodermis-specific genes bli-3, bli-4, and lin-26 in sid-1, daf-2; sid-1, or glp-1; sid-1 strains expressing sid-1 in the intestine (data not shown). Scale bar = 400 µm. Data representative of at least two independent experiments. (B) Fluorescence images (GFP), strains express vha-6p::sid-1::sl2::gfp and DIC images (insets) of Day 3 adult animals fed from hatching with bacteria containing empty vector (control) or gfp-encoding dsRNA. Scale bar = 200 µm. Data representative of at least two independent experiments. (C) Schematic of sid-1 gene with primers 1, 2, and 3 indicated by arrows. Black boxes and lines indicate exons and introns, respectively. (D,E) PCR analysis using primers 1 and 3 (D), or 1 and 2 (E) to detect sid-1 transgene expression in (a) glp-1(e2141); sid-1(qt9), (b) daf-2(e1370); sid-1(qt9), (c) glp-1(e2141); sid-1(qt9); myo-3p::sid-1, (d) daf-2(e1370); sid-1(qt9); myo-3p::sid-1, (e) glp-1(e2141); sid-1(qt9); vha-6p::sid-1, (f) daf-2(e1370); sid-1(qt9); vha-6p::sid-1, (g) sid-1(qt9); vha-6p::sid-1, and (h) WT animals. Data are representative of at least two independent experiments. Units are number of base pairs. (F) Fluorescence images (mCherry) of Day 1 adult WT or daf-2(e1370) transgenic animals expressing atg-18p::atg-18::mCherry fed from hatching with bacteria containing empty vector (control) or atg-18/Wipi dsRNA. (G) Quantification of fluorescence intensity in the anterior intestine of Day 1 adult WT or daf-2(e1370) animals expressing atg-18p::atg-18::mCherry fed from hatching with bacteria containing empty vector (control) or atg-18/Wipi-encoding dsRNA. Data are the mean ± SEM and are representative of three independent experiments, each with ≥10 animals. ****p<0.0001 by one-way ANOVA. Scale bar = 100 µm.