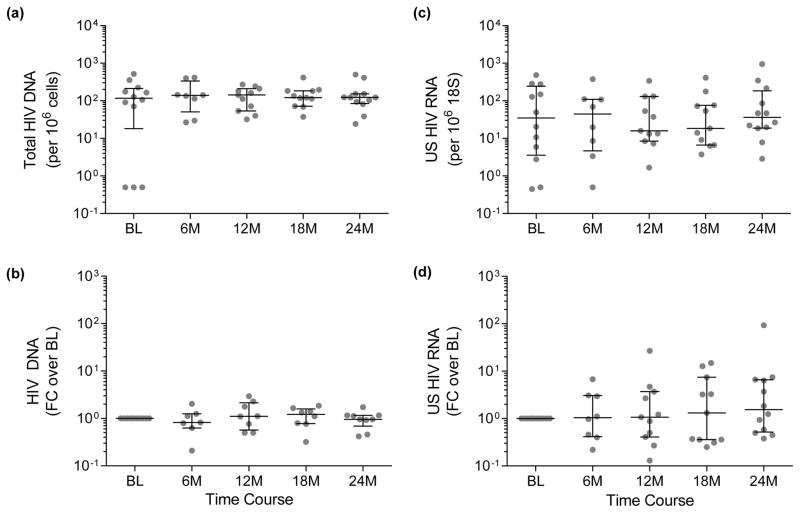
Fig. 1. Changes in total HIV DNA and CA-US HIV RNA over 24 months follow up after daily vorinostat for 14 days.
(a) Total HIV DNA was measured per million cells and (b) fold changes (FC) in DNA were calculated relative to baseline values. (c) CA-US HIV RNA was measured relative to 18S RNA and (d) fold changes were calculated relative to baseline. Median and IQR are shown for each time point. Comparisons of RNA or DNA to baseline were made using the Wilcoxon test. There were no significant changes in these parameters over time.

