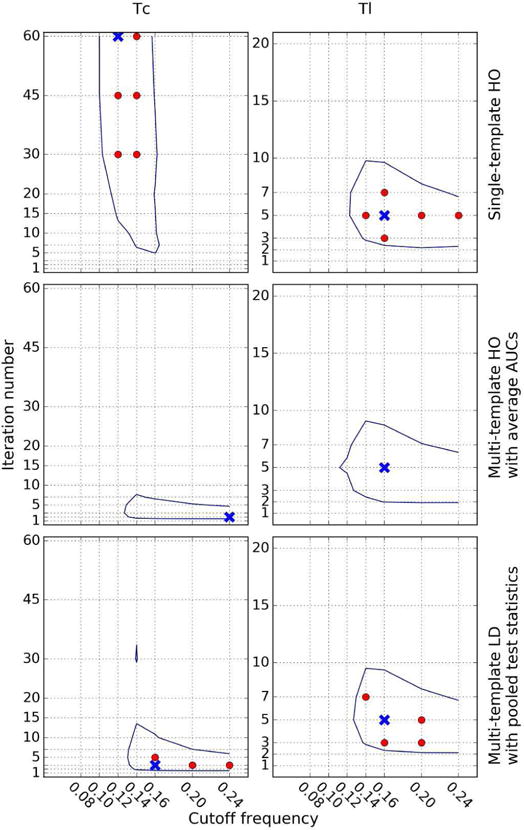
Fig. 10.

Optimal parameters for all defect types for Tc (left) and Tl (right) using (top to bottom): single-template HO, multi-template HO with averaged AUCs, and multi-template LD with pooled test statistics strategies. The crosses represent the set of parameters that achieved the maximum AUC. The filled circles represent the parameter points where the difference in AUC with respect to the maximum AUC was not statistically significant. The contour line indicates the region where AUC values differed from the optimal one by no more than 0.01, a difference considered clinically important. We used 4 subsets/iteration during the OS-EM reconstructions.
