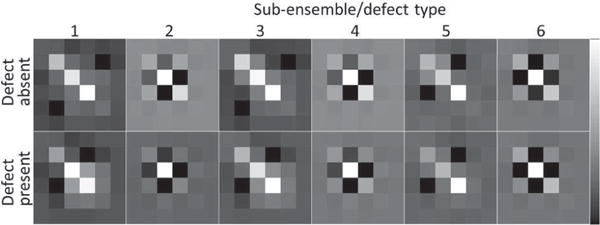
Fig. 5.

Covariance matrices under the two hypotheses (top row: defect-absent, bottom row: defect-present) for the six sub-ensembles (the 1st to the 6th columns are corresponding to defect type 1 to 6, respectively) for Tc images at iteration number 5 (4 subsets/iteration) and cutoff frequency 0.1 pixel−1.
