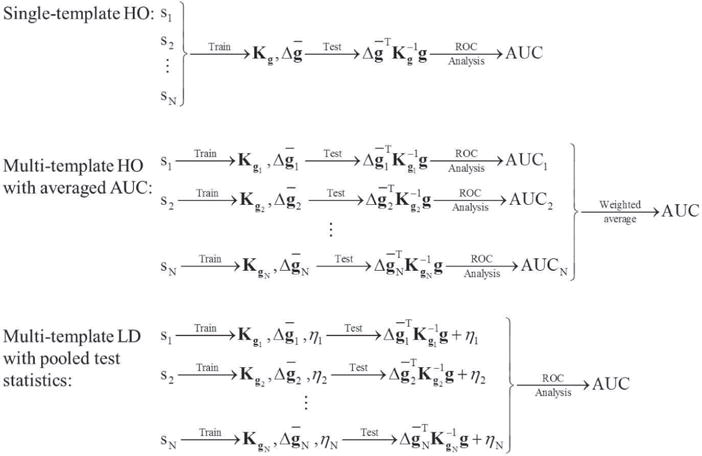
Fig. 6.

Diagram illustrating the data flow for the three observer strategies investigated. Sj stands for the jth sub-ensemble (1≤j≤N), where N is the total number of sub-ensembles. , Kgj, and ηj denote the mean data vector, the covariance matrix of the data, and the term defined in Equation (6) for the jth sub-ensemble, respectively.
