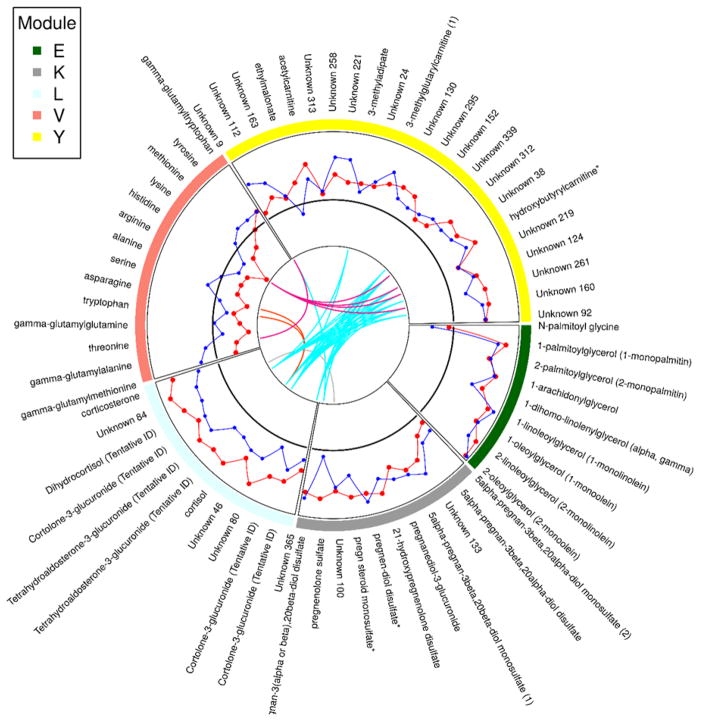
Figure 4. Significantly enriched modules.
Circle plot showing the normalized relative change from the quiescent stable disease state to the acute event state for metabolites in the 5 modules enriched for differences across groups. Stable CAD values are used as a reference and are represented by a solid black line. Thrombotic MI values are represented by a red line while non-thrombotic MI are represented by a blue line. Colored lines that span the center of the circle represents pairwise metabolite topological overlap above a fixed threshold.

