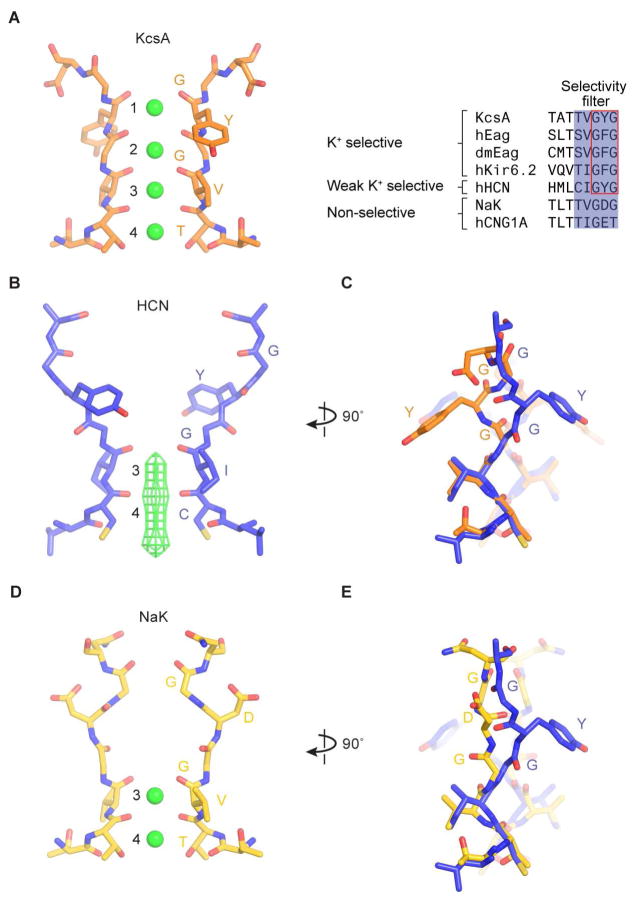
Figure 2. Selectivity filter of the HCN1 channel.
(A) Structure of the KcsA filter, a K+-selective filter (PDB ID: 1K4C). Discrete K+ binding sites (1 to 4) are labeled. K+ ions within the filter are represented as green spheres. A sequence alignment of the filter regions from selected channels is shown on the right.
(B) Structure of the HCN1 filter, a weak K+-selective filter. The density of K+ ions is represented as green mesh. The map is sharpened with a b-factor of −120 Å2, and contoured at 5.5 σ.
(C) Comparison of the HCN1 and KcsA filters. The superposition of the HCN (blue) and KcsA filters (orange) is based on Cα atoms of residues 357 to 359 of the HCN channel. K+ ions in the KcsA channel are removed for clarity.
(D) Structure of the NaK filter, a non-selective filter (PDB ID: 2AHZ).
(E) Comparison of the HCN1 and NaK filters.
See also Figure S6.

