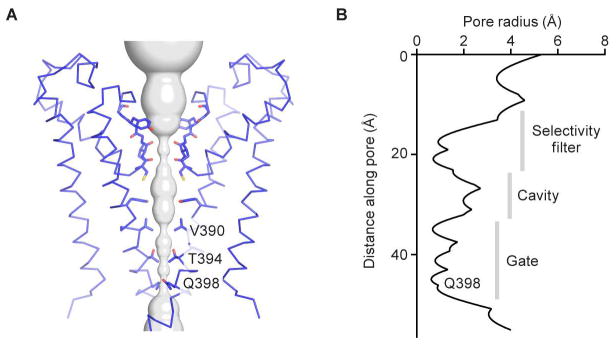
Figure 3. Pore of the HCN1 channel.
(A) Ion pore with only two subunits shown, viewed from within the membrane. The minimal radial distance from the center axis to the protein surface is colored in gray. Selected residues facing the pore are in stick representation and constricting residues are labeled.
(B) Radius of the pore. The van der Waals radius is plotted against the distance along the pore axis.

