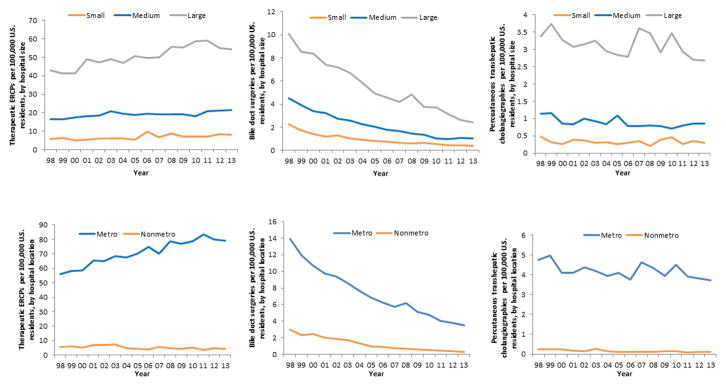
Figure 5.
Age-standardized trends in the rate of therapeutic ERCP (A), BDS (B), and PTC (C) by hospital size. Age-standardized trends in the rate of therapeutic ERCP (D), BDS (E), and PTC (F) by hospital metropolitan status. See text for description of classifications of hospital characteristics. See Supplementary Tables 9 and 10 for corresponding data tables. Metro; metropolitan-located hospital; non-metro; non-metropolitan located hospital.

