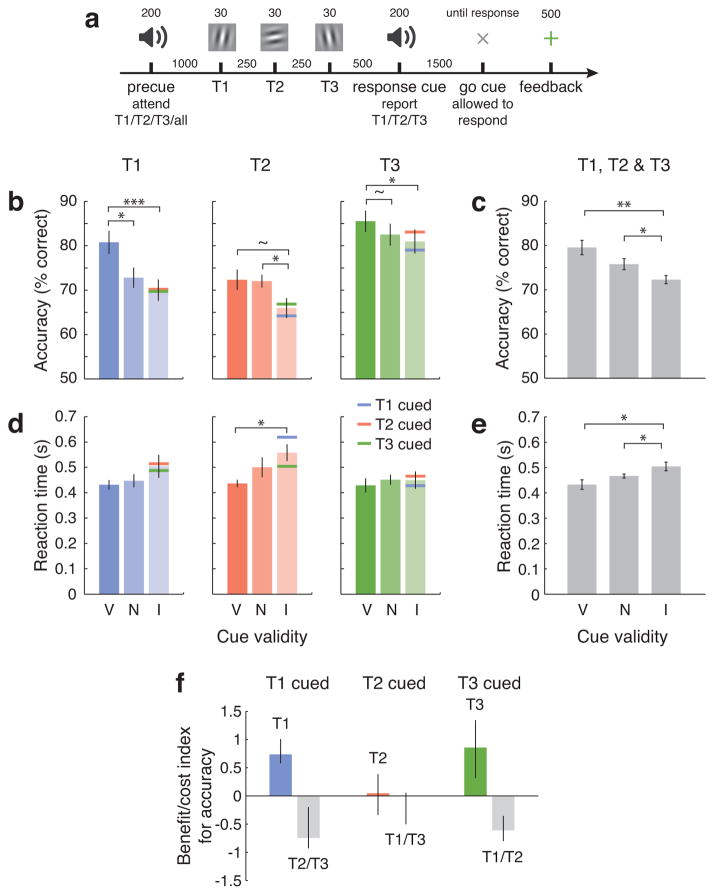
Figure 2.
Experiment 2: Three-target discrimination task and results. (a) Schematic of trial timeline showing stimulus durations and SOAs in ms. Same as Experiment 1, except 3 targets were presented on each trial, and a 1500 ms delay was enforced before observers were allowed to respond (indicated by dimming the fixation cross). Precues and response cues were pure tones (high=T1, medium=T2, low=T3, all simultaneously=neutral). (b) Accuracy, (c) mean accuracy across targets, (d) reaction time, and (e) mean reaction time across targets. Bars show means and error bars show within-observers s.e.m. (Morey, 2008) for the three temporal cueing conditions (V=valid, N=neutral, I=invalid). Colored lines on invalid bars indicate performance conditioned on cued target. (f) Benefit indices and cost indices (plotted as negative) for accuracy calculated separately for each possible target pairing (T1/T2, T1/T3, T2/T3), with costs conditioned on the cued target (colored lines in panel b). For visualization, the indices were averaged across the two pairings associated with each cued target. Error bars are 68% bootstrapped confidence intervals. n=10 observers. ~ p<0.1, * p<0.05, ** p<0.01, *** p<0.001.

