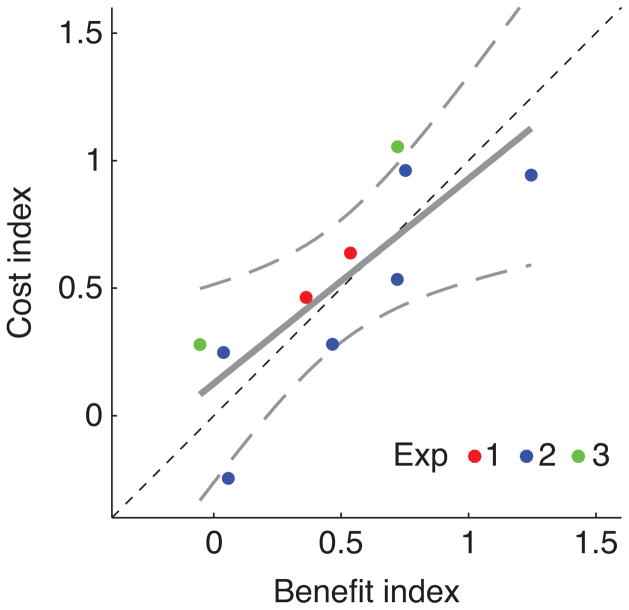
Figure 4.
Experiments 1–3: Perceptual tradeoffs. For each experiment, the attentional benefit index for a given target is plotted against the paired attentional cost index for another target. For example, the benefit for T1 is paired with the cost for T2 when T1 was cued. Red = Experiment 1, blue = Experiment 2, green = Experiment 3. For Experiment 2 (3 targets), benefit and cost indices are calculated and plotted separately for each possible target pairing (T1/T2, T1/T3, T2/T3). The gray solid line shows a linear fit to the data, with 95% confidence intervals bounded by gray dashed curves. Thin black dashes show the unity line (benefits = costs).

