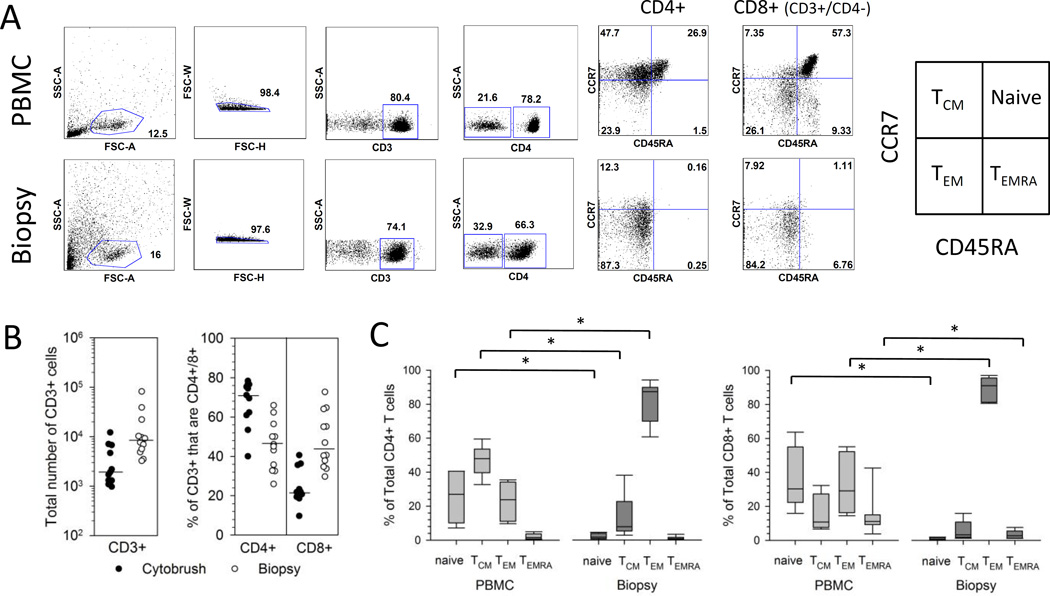
Figure 1. Phenotype of T cells isolated from cervix and PBMC.
(A) Representative flow cytometry gating strategy for the enumeration of T cell subsets. Cells isolated from PBMC (top row of graphs) and a cervical biopsy (bottom row of graphs) from a representative participant were gated on lymphocytes, singlets, live cells, CD3+ cells, and finally CD4+ and CD8+ (CD3+/CD4-) cells. The expression of CCR7 and CD45RA was analyzed on total CD4+ and total CD8+ (CD3+/CD4-) cells and gated as quadrants. The box at right labels quadrants (15). (B) Yield and T cell subset composition of CD3+ T cells from cervical samples. Cells were isolated from cytobrush (closed circles) or biopsy (open circles) samples and enumerated for the total number of CD3+ cells (left graph). The % of the total CD3+ cells that are CD4+ or CD8+ (CD3+/CD4-) is displayed in the right graph. Medians are presented as bars. (C) Cervix-derived CD4+ and CD8+ T cells are predominantly TEM. Percentage contribution of each T cell population to the total CD4+ (left) or CD8+ (right) T cell subset from PBMC or cervical biopsy is displayed from HSV-2-infected participants (n=7). Each box displays the median, 25th and 75th percentiles and error bars display the 10th and 90th percentiles.

