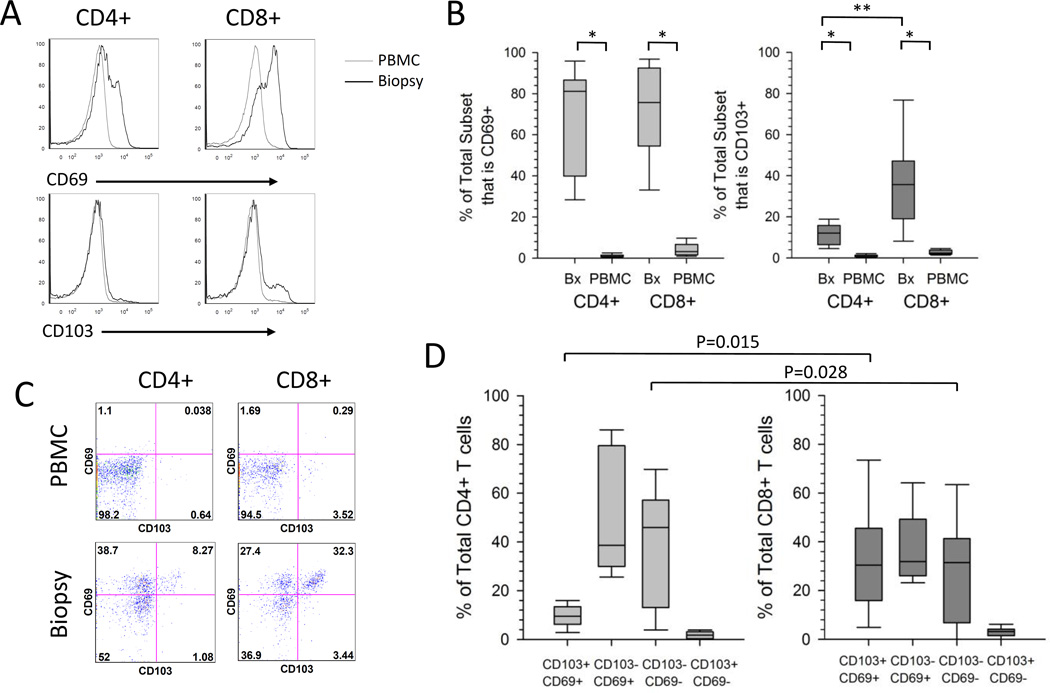
Figure 2. Expression of TRM-associated markers on total T cells isolated from the cervix or PBMC.
(A) Representative histograms to measure the expression of CD69 and CD103 on CD4+ and CD8+ T cells. T cells isolated from PBMC (grey line) or cervical biopsy (black line) from a representative participant were analyzed by flow cytometry. (B) Expression of CD69 and CD103 on T cells. The percentage contribution of CD69+ and CD103+ to the total CD4+ or CD8+ T cell subset isolated from PBMC or cervical biopsy from HSV-2 infected participants (n=9) is displayed. Each box displays the median, 25th and 75th percentiles and error bars display the 10th and 90th percentiles from HSV-2 infected participants (n=9). *,P=0.008 ; **, P=0.015). (C) Representative dotplots displaying the co-expression of CD103 and CD69 on PBMC or cervix derived CD4+ and CD8+ T cells from a representative participant. (D) Co-expression of CD69 and CD103 on T cells derived from the cervix. The percentage contribution of each of 4 populations to the total CD4+ or CD8+ T cell subset from cervix-derived T cells from HSV-2 infected participants (n=9) is displayed. Each box displays the median, 25th and 75th percentiles and error bars display the 10th and 90th percentiles.

