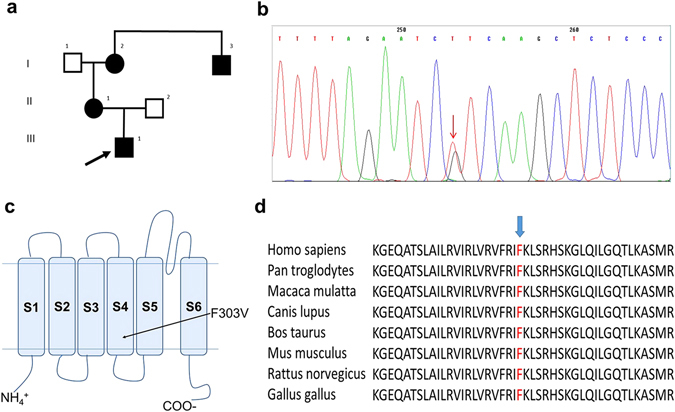
Figure 1.

Detecting and analyzing the mutation. (a) Pedigree of patient’s family. The arrow indicates the proband, black symbols indicate affected subjects. (b) DNA sequencing chromatogram of a section of KCNA1 (Kv1.1) exon 2 showing the heterozygous mutation segregating in the family. The arrow indicates the c907 T > G nucleotide substitution. (c) Schematic topology model of the human Kv1.1 subunit showing approximate site for the F303V mutation in the S4 segment. (d) Alignment of the region of interest for Kv1.1 channels from various species using MUSCLE 3.6. The arrow indicates the affected phenylalanine.
