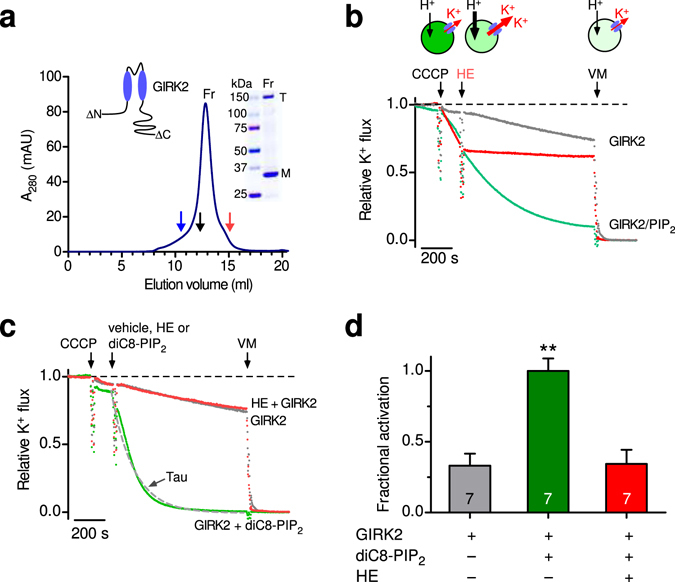
Figure 1.

Brain PIP2 and soluble PIP2 activate reconstituted brain GIRK2 channels in the absence of other proteins. (a) Graph shows purification of mouse GIRK2 from Pichia pastoris. The absorbance is plotted as a function of elution volume, with molecular weight (MW) standards; Blue - 440 kDa, Black - 158 kDa, Red - 75 kDa (arrows). The major peak elutes at a volume consistent with the size of a GIRK2 tetramer (T). Inset, Coomassie blue staining of a gradient SDS-PAGE protein gel shows two bands, one for tetramer (T) and one for monomer (M). Inset, wild-type GIRK2 was truncated at the amino- and carboxy-termini (see methods). (b) Example of K+ flux assay with GIRK2 reconstituted into PE/PG liposomes in the absence or presence of brain PIP2 (1%) (see methods). The fluorescence is normalized and plotted as a function of time (‘Relative K+ flux’). Arrows indicate addition of the proton ionophore carbonyl cyanide m-chlorophenylhydrazone (CCCP), the GIRK2 channel blocker MTS-HE (HE, 100 μM) and valinomycin (VM). Note the quenching of fluorescence for GIRK2 with PIP2 (green) upon addition of CCCP, which is attenuated with addition of MTS-HE. Dashed line represents no flux. (c) Representative fluorescent traces of GIRK2 alone (grey), GIRK2 and MTS-HE (red), and GIRK2 with acute application of 30 μM diC8-PIP2 (green). The decay was fit with a single exponential to determine that rate constant (1/τ, s-1). (d) Bar graph shows the average ( ± SEM) fractional activation with diC8-PIP2 based on the change in steady-state fluorescence (green bar vs. grey bar). MTS-HE (red bar) significantly inhibits diC8-PIP2-activated GIRK2 channels (n = 7, P < 0.0001).
