
Figure 6.
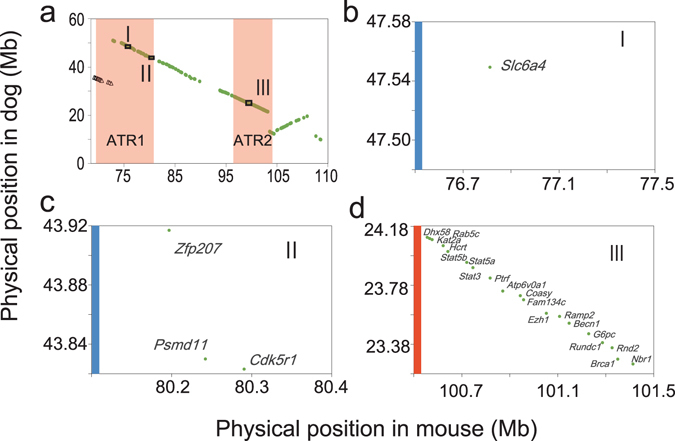
Comparative analysis of the mouse and dog genomes. We performed a comparative analysis of the mouse and dog genomes to determine whether the syntenic region of ATR1 was selected during the domestication of dogs. We first downloaded gene data for orthologues from Ensembl (Archive EnsEMBL release 67; NCBI m37 for mouse and CanFam2.0 for dog). We then used selective sweep datasets that referred to the domesticated region from previous publications18,19. Overlapping genes between the orthologues and the selective sweep regions were then extracted. (a) Plot of the genes on mouse chromosome 11 expressed in mouse brain (x-axis) against synteny in dogs (y-axis). Triangles are dog chromosome 5, circles are dog chromosome 9. (b–d) Syntenic regions of mouse chromosome 11 in dogs and regions that have been selected during the domestication of dogs, identified by performing genomic comparisons of grey wolves and dogs (vertical blue line) and of 10 domesticated dog breeds (vertical orange line).