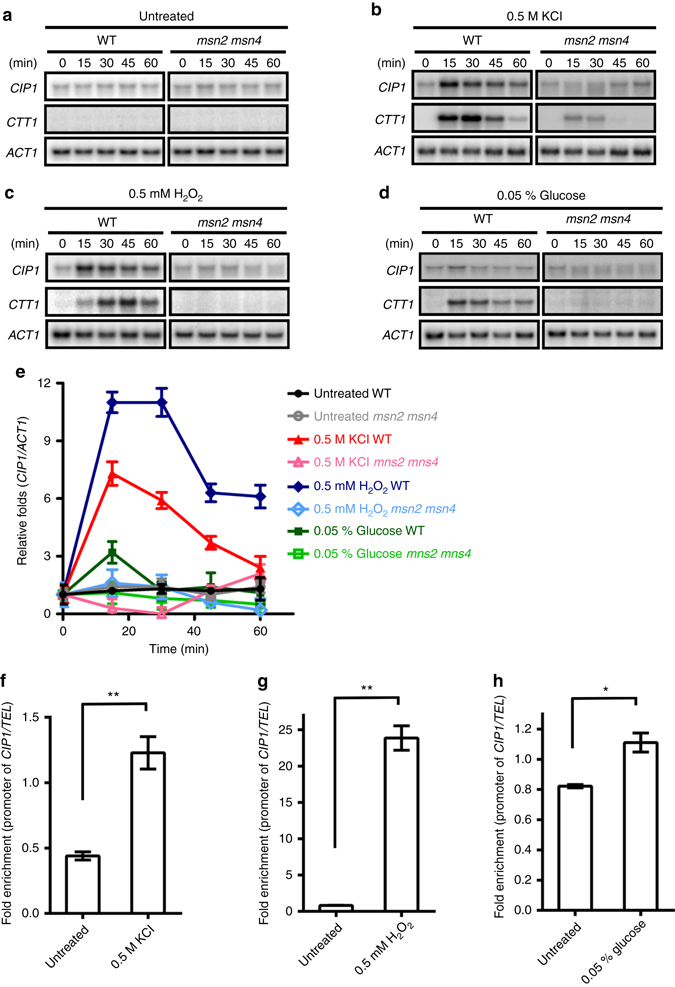
Fig. 3.

CIP1 expression is induced under several stresses. Yeast cells were treated with various stresses including a untreated, b osmotic stress (0.5 M KCl), c oxidative stress (0.5 mM H2O2), and d carbon source starvation (0.05% glucose). Samples were collected at the indicated time points after stress treatment. Total RNA was analyzed by Northern blotting and hybridized with indicated probes. CTT1 referred to the positive control of these stresses, and ACT1 was used as a loading control. e The band intensities displayed in the broken-line graph of each panel were quantified using Image J, normalized relative to respective internal controls, and expressed as the ratio of the CIP1 levels to the time point 0 at the beginning of each stress treatments. The values were given as mean ± s.d. (n = 3). mRNA expression was considered to be upregulated when relative fold exceeds 2. f–h ChIP analysis of Msn2 binding at the CIP1 promoter under f osmotic stress (0.5 M KCl), g oxidative stress (0.5 mM H2O2), and h carbon source starvation (0.05% glucose). The binding of Msn2 at the CIP1 promoter was normalized by that at the TEL sequence. The values are given as mean ± s.d. (n = 3,*P < 0.05, **P < 0.01, Student’s t-test, two-tailed)
