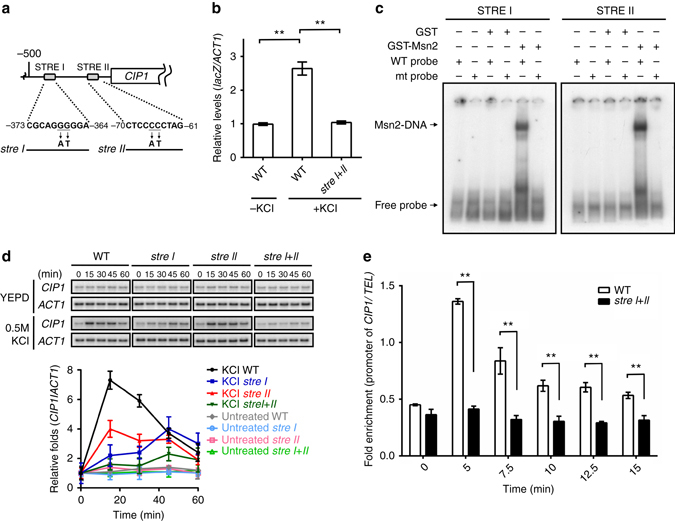
Fig. 4.

Msn2/4 regulate CIP1 expression through two STRE binding sites. a Schematic diagram indicates two putative STREs at the CIP1 promoter. The mutation sites that destruct STREs are shown below. b Reporter analysis was used to determine the contribution of STRE on the promoter activity of CIP1. Osmotic stress was induced by 0.5 M KCl. The lacZ expression was normalized by ACT1 expression. The values are given as mean ± s.d. (n = 3,**P < 0.01, Student’s t-test, two-tailed). c EMSA was performed with STRE I, mutant stre I, STRE II or mutant stre II-radiolabeled double-stranded oligonucleotides. Recombinant GST or GST-Msn2(401–704) proteins were subjected to EMSA. d Top: Northern blot analysis of CIP1 expression in WT and STRE mutant strains (stre I, stre II, and stre I + II) under osmotic stress. Bottom: The band intensities displayed in the broken-line graph was quantified using Image J, normalized relative to respective internal controls, and expressed as the ratio of the CIP1 levels to the time point 0 at the beginning of 0.5 M KCl treatments. The values were given as mean ± s.d. (n = 3). e ChIP analysis of Msn2 binding at CIP1 promoter under osmotic stress at indicated times. The binding of Msn2 at the CIP1 promoter was normalized by the TEL background. The values are given as mean ± s.d. (n = 3, **P < 0.01, Student’s t-test, two-tailed)
