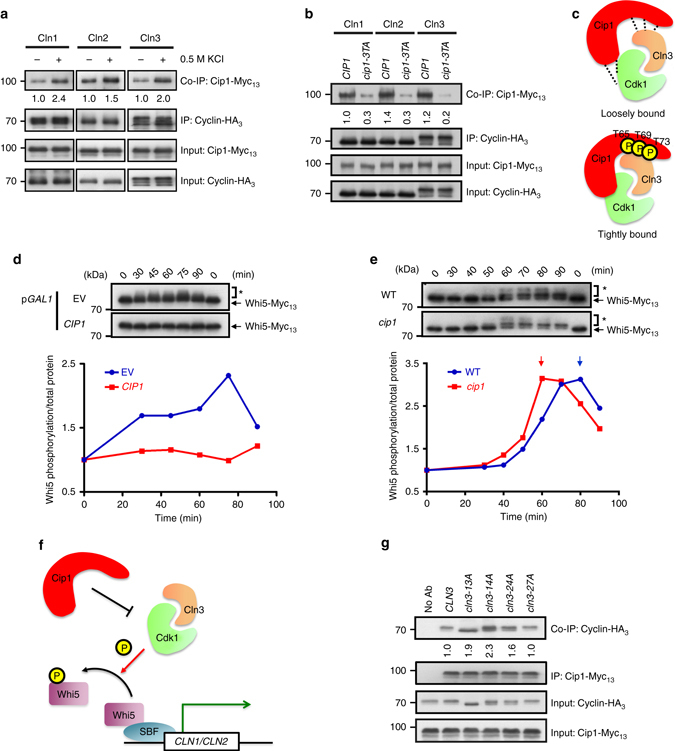
Fig. 7.

Cip1 regulates G1/S progression by inhibiting Cdk1–Cln3 complex activity. a Co-immunoprecipitation indicated that osmotic stress augments the Cip1–G1 cyclin interactions. Immunoprecipitation was conducted using an anti-HA antibody to pull-down GAL1 promoter-driven cyclins. The levels of signal compared with that of the untreated cells are shown below. b Co-immunoprecipitation indicated that Cip1 phosphorylation site mutation impairs the Cip1–G1 cyclin interactions. c A cartoon describes the function of phosphorylation of Cip1. The phosphorylation of Cip1 on T65, T69, and T73 increases the binding affinity between Cip1 and Cdk1–Cln3 complex. d The Myc13-tagged WHI5 strain harboring empty vector, GAL1-CIP1, or GAL1-cip1-3TA was synchronized at G1 by α-factor in 2% raffinose. Cip1 was induced in the present of 2% galactose. The α-factor was subsequently removed from the cultures and samples were collected at 15-min intervals for 90 min at 24 °C. Whi5 was detected by western blotting using an antibody against Myc, and the phosphorylated Whi5 was indicated by an asterisk (*). The relative band intensities of phosphorylated Whi5 to total Whi5 was quantified and expressed as the ratio of the phosphorylated Whi5 levels to the time point 0. e The chromosomal WHI5 was tagged with Myc13 in WT and cip1 cells. Cells were synchronized at G1 by α-factor and released into 0.5 M KCl YEPD. Cells were collected at 10-min intervals for 90 min at 24 °C. Whi5 was analyzed by western blotting as d. f A cartoon describes the inhibitory pathway of Cip1 to Cdk1–Cln3 complex. The interaction between Cip1 and Cdk1–Cln3 complex inhibits the kinase activity of the Cdk1–Cln3 complex. The inhibition blocks Whi5 phosphorylation, which prevents SBF to transcribe G1/S genes. g Co-immunoprecipitation between Cip1 and Cln3, Cln3-13A, Cln3-14A, Cln3-24A and Cln3-27A. Immunoprecipitation was conducted using an anti-Myc antibody to pull-down GAL1 promoter-driven Cip1. The band intensities displayed below depict quantification of the relative amount of Cln3 proteins that co-immunoprecipitate with Cip1
