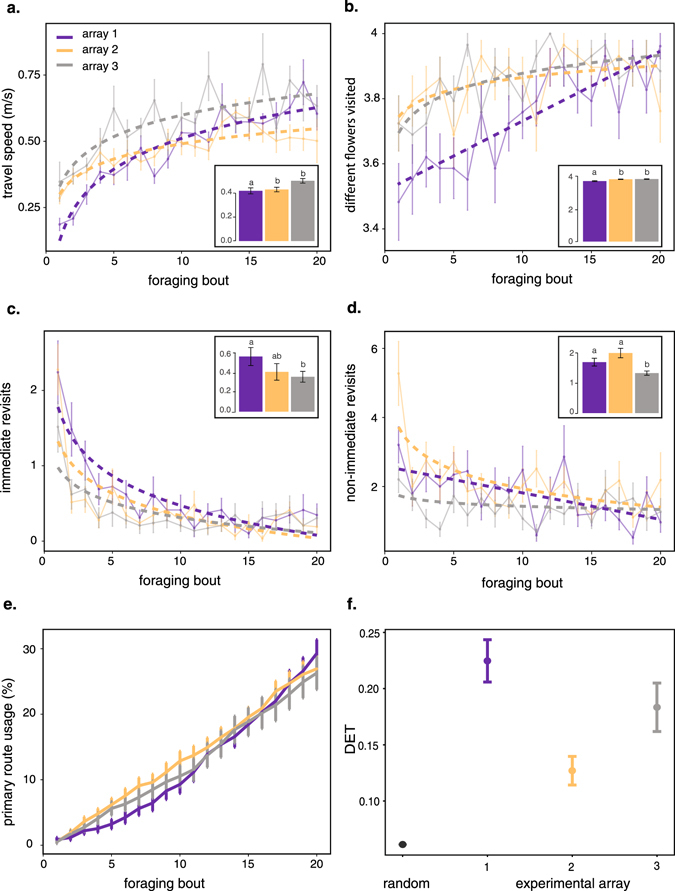
Figure 2.

Average behavioural measures in the three experimental arrays (array 1: purple, array 2: orange, array 3: grey, see details of flower and landmark configurations in Fig. 1). (a) Travel speed per foraging bout (flight duration divided by the Euclidian distance between all successively visited flowers). (b) Number of different flower visited per foraging bout. (c) Number of immediate revisits to flowers per foraging bout (when the bee visited the same flower twice in a row). (d) Number of non-immediate revisits per foraging bout (when the bee revisited a flower after having visited one or more different flower locations). (e) Cumulative frequency of primary route usage per foraging bout. (a–e) plain lines show means ± SE (N = 29 bees), dashed lines show regression models (see details in Table 1 and Supplementary Table S1). (f) Comparison between simulated random determinism index (DETs, N = 1000 simulations) and observed DETs (N = 29 bees) in each experimental array (mean ± SE). (a–d) Bar plots show means ± SE for each array of flowers. Tukey post-hoc analysis: different letters above bars represent significant differences between arrays (see details in Supplementary Table S2).
