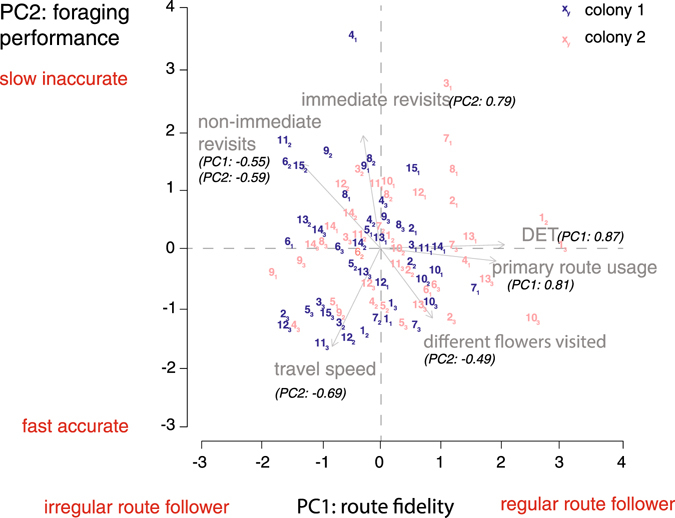
Figure 3.

Correlations between the two first components (PCs) of the principal component analysis (PCA). Grey arrows represent the six behavioural measures on PC1 (route fidelity) and PC2 (foraging performance). PC loadings are in brackets. Only loadings >|0.4| were retained (see Supplementary Table S3 for the complete PCA loadings). Each data point represents the PC1 and PC2 scores of a given bee in each experimental array. The PCs define a continuum between four behavioural extremes: fast accurate and regular route followers, fast accurate and irregular route followers, slow inaccurate and regular route followers, slow inaccurate and irregular route followers. Blue: colony 1 (N = 15 bees, 45 data points), red: colony 2 (N = 14 bees, 42 data points). Numbers refer to individual bees (same number code as in Figs 4 and 5). Subscripts refer to experimental arrays (1–3).
