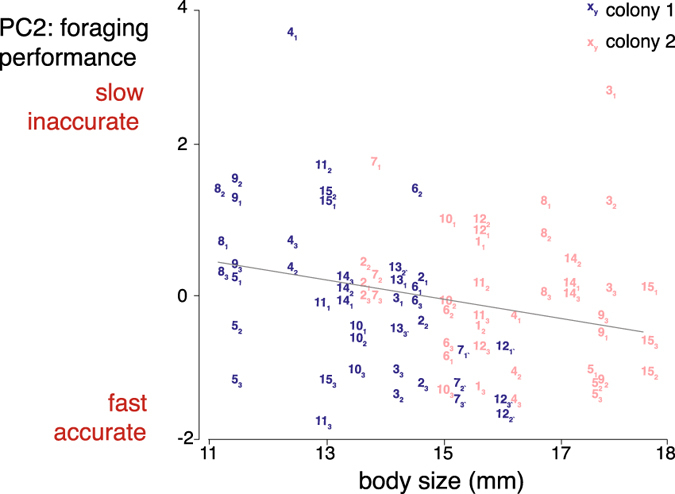
Figure 5.

Inter-individual variance in foraging performance (PC2) is partly explained by body size (length from top of head to end of abdomen). Each data point represents the average score of an individual in an experimental array (three values per individual). Blue: colony 1 (N = 15 bees), red: colony 2 (N = 13 bees). Numbers refer to individual bees (the same number code was used in Figs 3 and 4). Subscripts refer to experimental arrays (1–3). Marginal R2 = 0.12, conditional R2 = 0.44.
