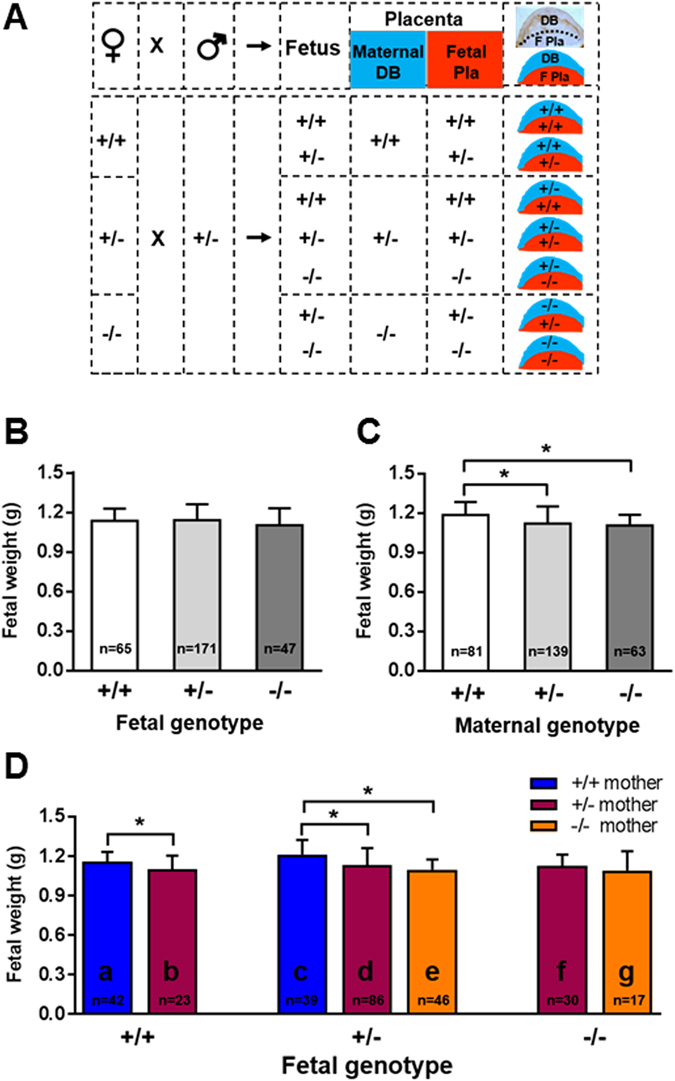
Figure 2.

The impact of HtrA3 gene deletion in the mother versus fetus on E18 fetal weight. (A) The mating scheme to analyze the maternal and fetal contribution to the genomic makeup of the placenta. The top row illustrates that when a female (♀) is mated to a male (♂) mouse, the resulting fetus and placenta will be genetically related but not identical. The mouse placenta is comprised of maternal decidua basalis (DB) and fetal placenta (F Pla), genetically the maternal component will be identical to the mother, whereas the fetal component will be similar to the fetus. An actual image of a d10.5 placental section is shown at the far right top corner, displaying the maternal DB on the top (stained for desmin in brown) and the F Pla on the bottom. Immediately below it is a schematic drawing of the placenta, showing the maternal DB on the top in blue and F Pla on the bottom in red. The lower section of the figure shows the scheme for mating female mice of three HtrA3 genotypes (+/+, +/− or −/−) with males of HtrA3 heterozygous (+/−) to generate three HtrA3 genotypes (+/+, +/− or −/−) of fetuses but seven genotypes of placentas. Each placental type is schematically drawn to show the HtrA3 genotype of the maternal DB (top in blue) and the F Pla (bottom in red). (B–D) Fetal weight at E18. Data were analyzed according to the genotype of the fetus (B), the mother (C), and the fetus as well as the mother (D). The number of fetuses examined for each group is shown on the graph. The 7 distinctive groups in (D) are labeled as “a, b, c, d, e, f, g” respectively, and this labelling system is consistently applied to other figures. Data are expressed as mean ± SD. *p < 0.05.
