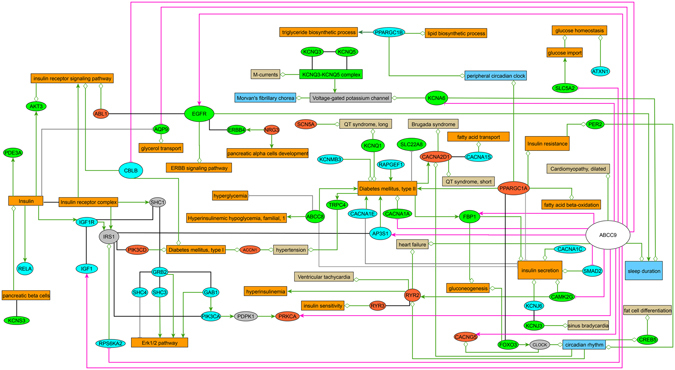
Figure 1.

Human gene vs. disease multifactorial interaction network. The network shows interactions between genes from significant pathways (ERBB signaling family of tyrosine kinases and ion channels) identified based on the GWAS datasets (Meta3, green nodes; Meta7, light-blue nodes; overlapping genes between Meta3 and Meta7, orange nodes) and the Drosophila transcriptome GSEA. Only human homologs of the respective Drosophila genes with altered expression in the dSur KD flies in relation to controls (Fig. 2) were included. Relationships between the respective genes and biological processes (diabetes, carbohydrate and lipid metabolism, orange; cardiovascular diseases, beige), protein complexes and phenotypes (abnormal sleep and circadian behaviour, blue) are also shown (decreased activity/expression, grey edges with cross bar; increased activity/expression, green colored arrows; modulated activity/expression, green edges with open diamond). Red edges indicate gene expression for flies pooled every 3 h of the 24 hours period (decreasing expression, cross bar; increased expression in relation to wild-type controls, arrows; ratio RNAi/wt). Protein-protein interactions are displayed as black edges; interlinking genes are shown as grey nodes. A list of interactions with literature references is available in the Supplementary Table S8.
