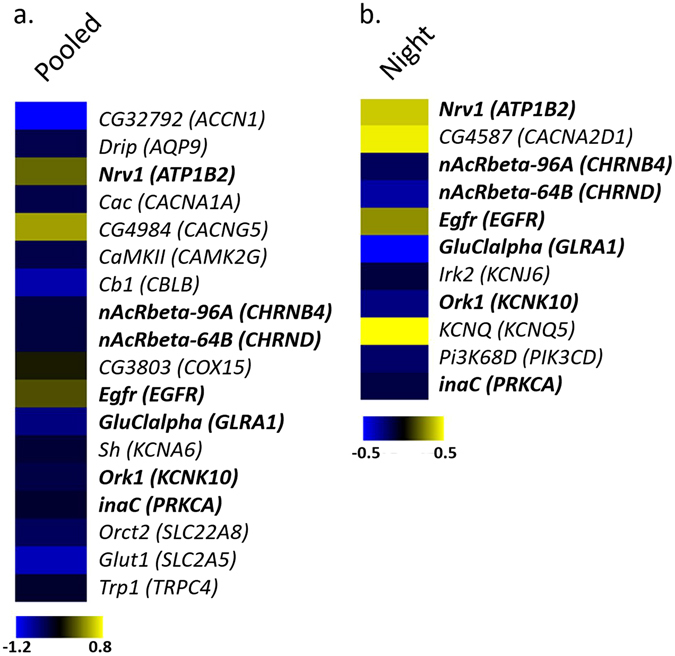
Figure 2.

Differentially expressed genes in dSur KD flies vs. controls. Heat map representing a selection of deregulated transcripts homologs to human genes (indicated in brackets) associated with sleep duration in the meta-analysis results used for the GSEA in (a) “Pooled” (Drosophila pooled every 3 h of the 24 hours period) and (b) “Night” (3 h into the night) conditions. A color-coded scale for the normalized expression values is used as follows: yellow and blue represent high and low expression levels in dSur KD with respect to control, respectively. The expression level of each transcript was calculated as the log2 (dSur KD/control), and the complete lists of differentially expressed genes identified by LIMMA software are provided in the Supplementary Table S7.
