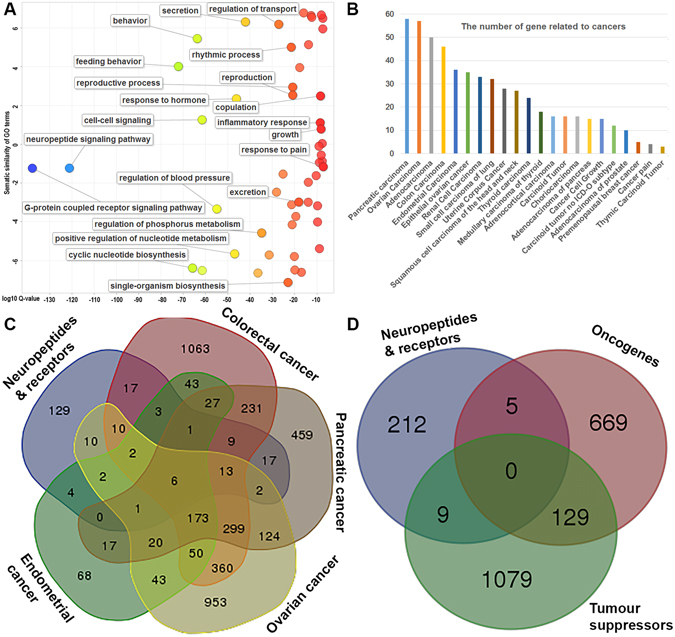
Figure 2.

Functional analysis of the 93 neuropeptides and 133 receptors. (A) Scatterplot showing the biological process cluster representatives terms from gene ontology (GO) for the 127 neuropeptides in a two-dimensional space derived by applying multidimensional scaling to a matrix of the GO terms’ semantic similarities. Y-axis indicates the similarity of the GO terms; x-axis indicates the log of corrected P-value (bubbles of right corrected P-values are larger). (B) Graph showing significantly enriched cancer-related terms for 93 neuropeptides and 133 receptor genes in human. (C) Venn diagram showing comparative overlap based on four literature-based cancer databases. (D) Venn diagram showing overlap of tumour suppressors and oncogenes.
