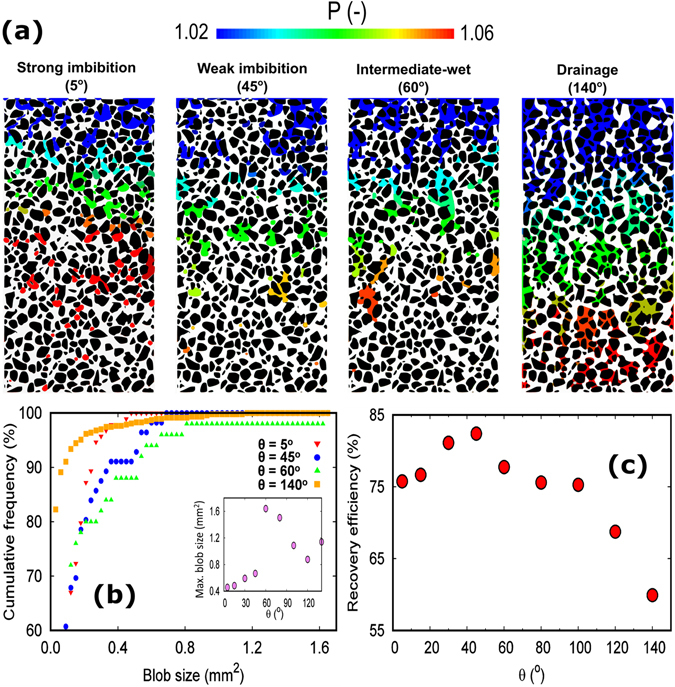
Figure 2.

(a) Fluid phase and pressure distribution under different wetting conditions at the end of simulation. White colour represents pathway of invading phase. Pressure is normalized with respect to the outlet pressure and it indicates the pressure in the defending phase. (b) Distribution of blobs size of defending fluid under different wettability scenarios. The inset illustrates the maximum blob size as a function of the contact angle. (c) The non-monotonic dependency of the defending phase recovery on the wettability of porous media.
