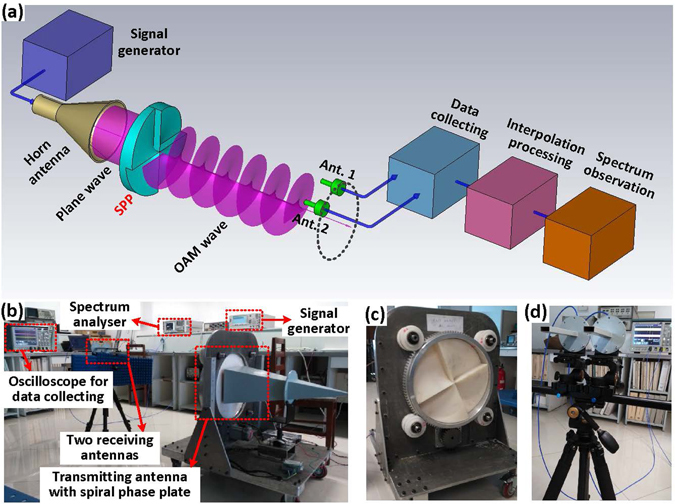
Figure 3.

Structure of the experimental system. (a) Transceiver structure for detecting the OAM mode using the VRA method. An EM beam is generated by a horn antenna and then passes through the SPP, which produces an OAM wave with mode number l. At the receiving side, the OAM wave is received by two antennas, which are deployed transversely across the doughnut-shaped beam, and then digitally sampled. The sampled data are input to a computer where the interpolation is performed using MATLAB. Afterwards, the interpolated data are output to a spectrum analyser (Agilent E4446A) for observation. (b) OAM mode detection experiment conducted in the laboratory. (c) Transmitting antenna fabricated by placing the SPP in front of a horn antenna. (d) Waveguide antennas used to receive the signals.
