Figure 2.

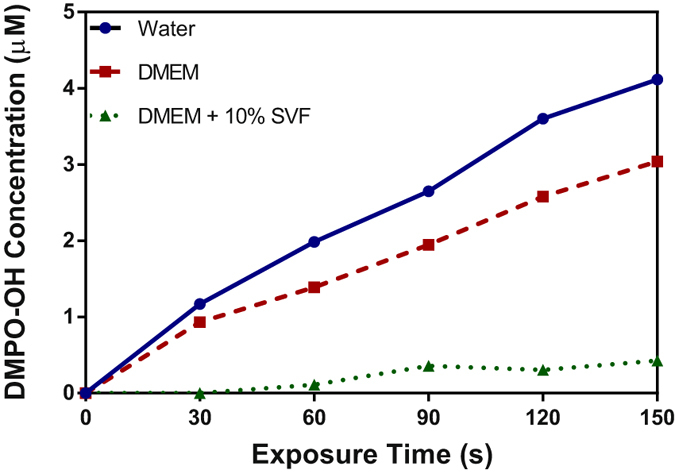
Variation of the concentration of DMPO-OH in water, DMEM + /− 10% FCS as a function of helium plasma jet exposure time. Half height of the second peak of the quartet EPR spectrum was chosen to represent DMPO-OH intensity.

Variation of the concentration of DMPO-OH in water, DMEM + /− 10% FCS as a function of helium plasma jet exposure time. Half height of the second peak of the quartet EPR spectrum was chosen to represent DMPO-OH intensity.