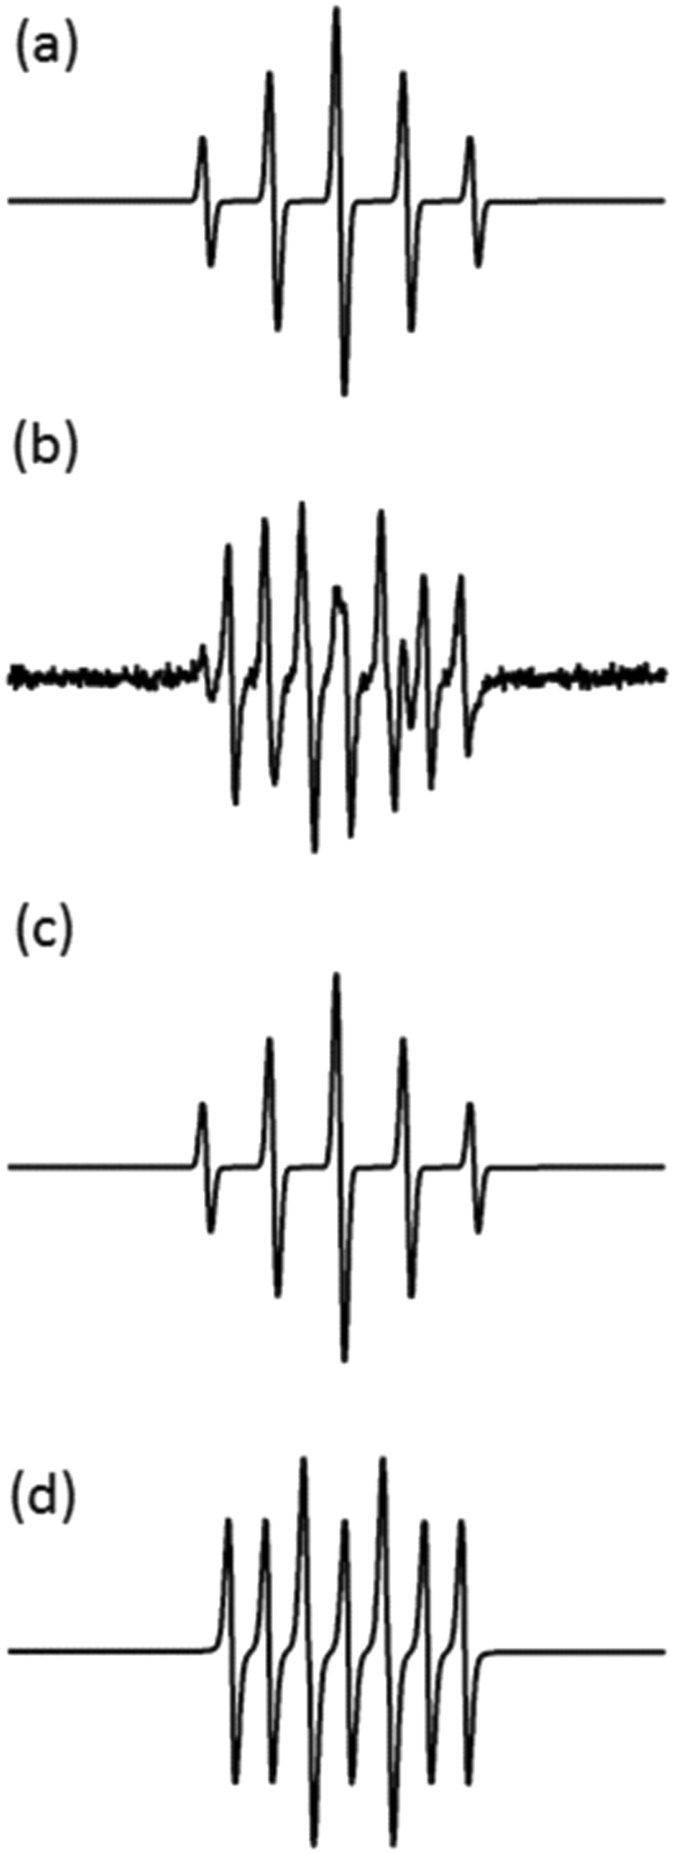
Figure 7.

EPR spectra of C-PTIO in Milli-Q water with or without plasma treatment. (a) Experimental spectrum of 166 µM C-PTIO in Milli-Q water. (b) Experimental spectrum of 16 6 µM C-PTIO in Milli-Q water after 150 s of plasma treatment. Two components are identified in experimental spectrum (b) by computer simulation represented in (c) and (d). (c) EPR simulation of C-PTIO identical with spectrum (a). (d) EPR simulation of C-PTI resulting of the interaction between C-PTIO and nitric oxide.
