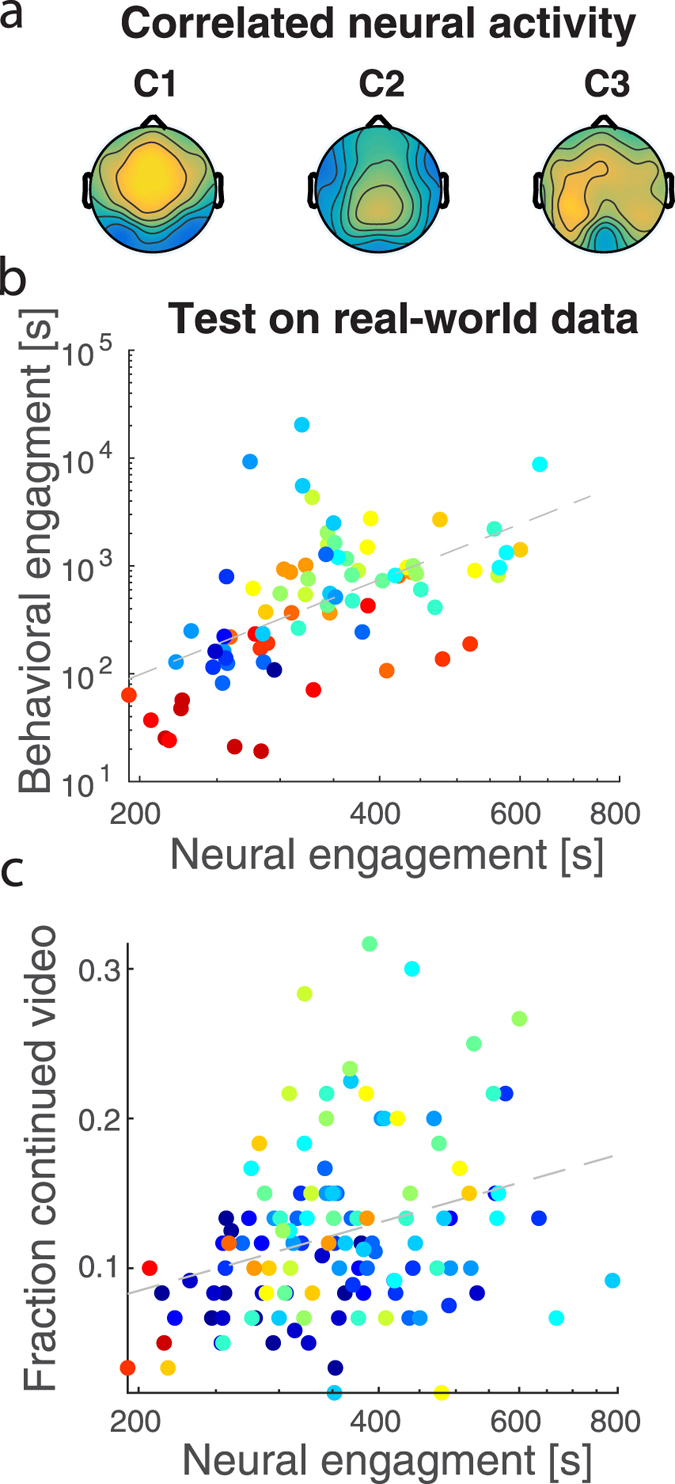
Figure 2.

Neural Engagement predicts Behavioral Engagement. (a) Spatial distribution of the three EEG components with maximal inter-subject correlation (ISC; C1–C3). Color indicates positive (yellow) or negative (blue) correlation between the source of the neural responses and each sensor on the scalp. Component C2, center, contributes most to the relationship between neural and behavioral engagement (see main text). (b) Neural engagement (; dashed line) predicts real-world behavioral engagement, using the model developed on the experimental behavioral engagement data (r = 0.56, p = 0.003, N = 78, for the 5 testing videos, ∆t = 12 s). (c) Neural engagement correlated with the fraction of a separate cohort of viewers that decided to continue to watch the videos when given the option to stop prematurely. Dashed line represents the regression line (r = 0.31, p = 0.0006, N = 122 intervals from all 10 videos). Each point represents a different time interval in each video colored according to time as in Fig. 1. Both engagement measures are displayed on a log-seconds scale.
