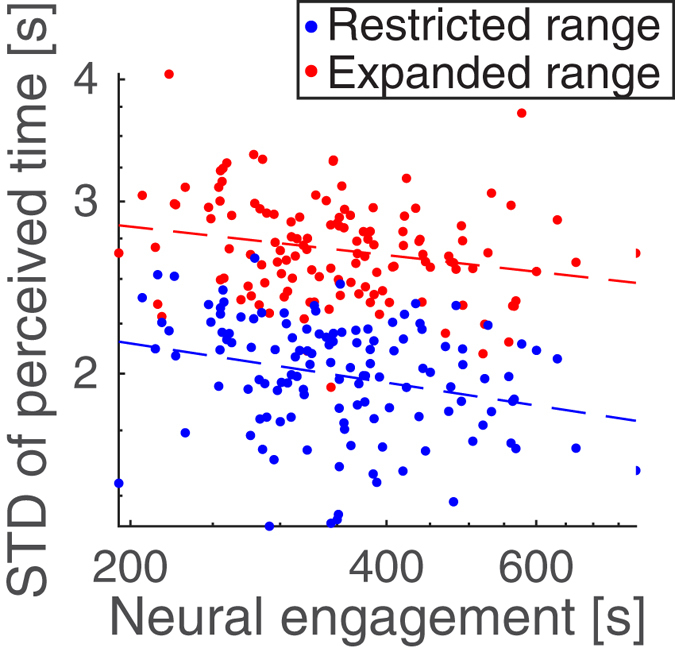
Figure 3.

Engagement predicts the variability of time perception. Viewers estimated the duration of time intervals within each video. Each point represents a time interval in a video. (a) The duration of intervals with high neural engagement were perceived less variably across viewers (r = −0.27, p = 0.0009, and r = −0.23, p = 0.05, N = 129 intervals for all 10 videos, for restricted and expanded range, respectively). Comparisons are made across two independent cohorts who had either a restricted range (blue, 8–16 s) or expanded range (red, 4–20 s) available for their time duration estimates. All time measures are displayed on a perceptual log-seconds scale.
