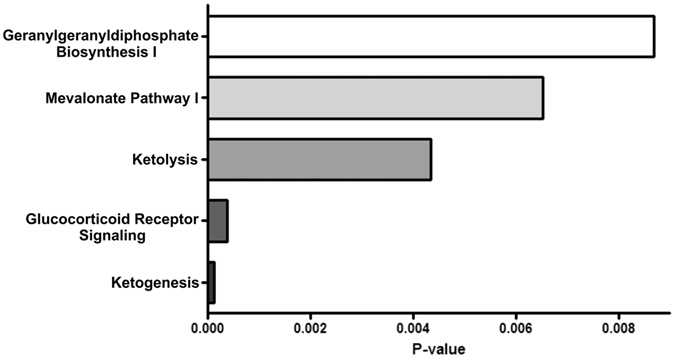
Figure 3.

IPA canonical pathway analysis of differentially expressed genes in STZ-treated T1D mice with cardiac dysfunction. The bar diagram represents the top 5 over-represented canonical pathways in T1D associated with CVD. Category names are presented on the y-axis. The x-axis indicates the p value of the over-representation analysis. The inclusion of pathways is based on the presence of any 10 differentially regulated genes in DCM.
