Figure 4.

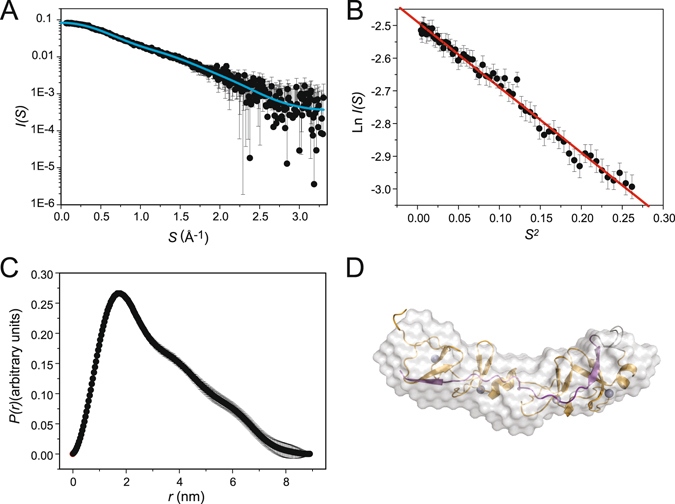
SAXS analysis for CEH-14–LIM-7. (A) Buffer-corrected, desmeared SAXS scattering curve of CEH-14–LIM-7 (circles; 5.2 mg mL−1) in 20 mM Tris pH 8.0, 150 mM NaCl, 1 mM TCEP, overlaid with the theoretical scattering profiles of an homology model of CEH-14–LIM-7 based on the template of the LHX3-ISL1 crystal structure (1RGT Chain B; cyan line) calculated by CRYSOL. (B) Guinier plot showing linearity of low Q data. (C) The pairwise distribution P(r) profile. (D) Shape restoration model of CEH-14–LIM-7 (white surface) superimposed with an homology model based on the template of the LHX3-ISL1 crystal structure (orange and purple; zinc ions are shown as grey spheres).
