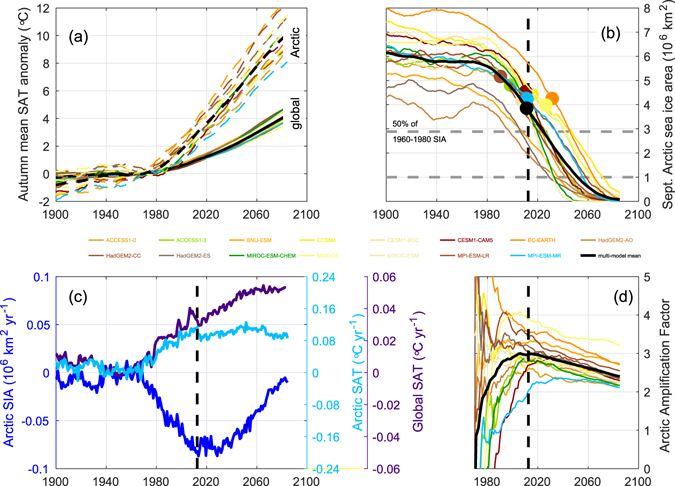
Figure 4.

Sea ice trends and peak Arctic amplification in CMIP5 historical runs and RCP8.5 projections. (a) Autumn (September to November) Arctic (north of 70°N) mean surface air temperature (SAT; dashed lines) and global mean SAT (solid lines). Temperatures are anomalies with respect to the relevant 1960–1980 mean and smoothed by a 30-year boxcar filter. (b) Arctic September mean sea ice area (SIA) from the CMIP5 models (colored lines) and the multi-model mean (black line). Colored circles mark the year in which each model run passes through Se = 1. The vertical black dashed line marks the multi-model mean peak year of sea-ice-related feedbacks (also shown in (c,d); see Fig. SI7). The lower horizontal gray dashed line marks the commonly-used 106 km2 threshold of an ice-free Arctic. The upper horizontal gray dashed line marks 50% of the 1960–1980 SIA value. (c) Rates of SIA and SAT change based on the 30-year running mean smoothed multi-model mean time series shown in (a, b). (d) Time series of the Arctic amplification factor defined as the ratio of Arctic to global SAT anomalies as shown in (a).
