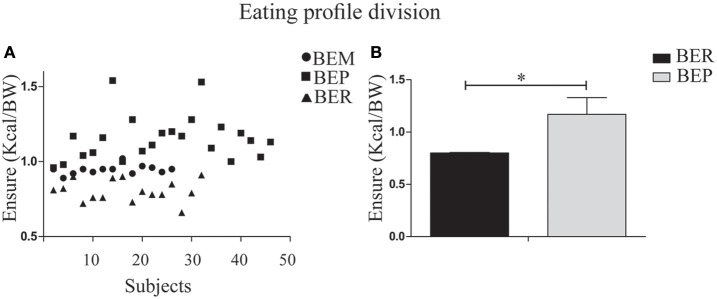
Figure 2.
Division of the rat population into BER/BEP status groups. (A) Subject scatter by mean Ensure PF intake over the second and third days of Phase 1. The x-axis represents the entire sample. BEM (binge eating middle third) rats were excluded from analysis. The lower tertile was determined as BER (mean PFcn ± SEM = 0.8 ± 0.07) and the upper tertile was determined as BEP (1.17 ± 0.14). (B) Mean Ensure PF intake for BER and BEP eating profile groups. *p < 0.05, **p < 0.005, ***p < 0.001.

