Figure 4.
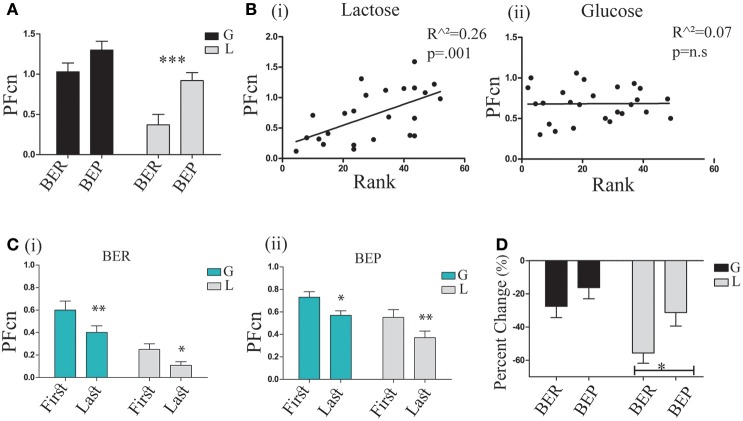
PF consumption during LCP. (A) Mean PFcn over total 4 h for the three conditioning tests for each group; BER-L consumed significantly less PFcn throughout LCP compared to BEP-L. (B) (i) Oreo cookies PFcn of lactose conditioned rats was predicted by rank order of Ensure PF intake during Phase 1 (ii) Oreo cookies PFcn of glucose conditioned rats was not predicted by rank order of Ensure PF intake during Phase 1. (C) ANOVA for repeated measures of the PFcn over LCP:1-3 for the first and last 2 h in both eating profile groups (i) BER and (ii) BEP. (D) Change in PFcn intake from the first 2 h to the last 2 h, throughout three conditioning tests (%, mean and S.E.M). *p < 0.05, **p < 0.005, ***p < 0.001.

