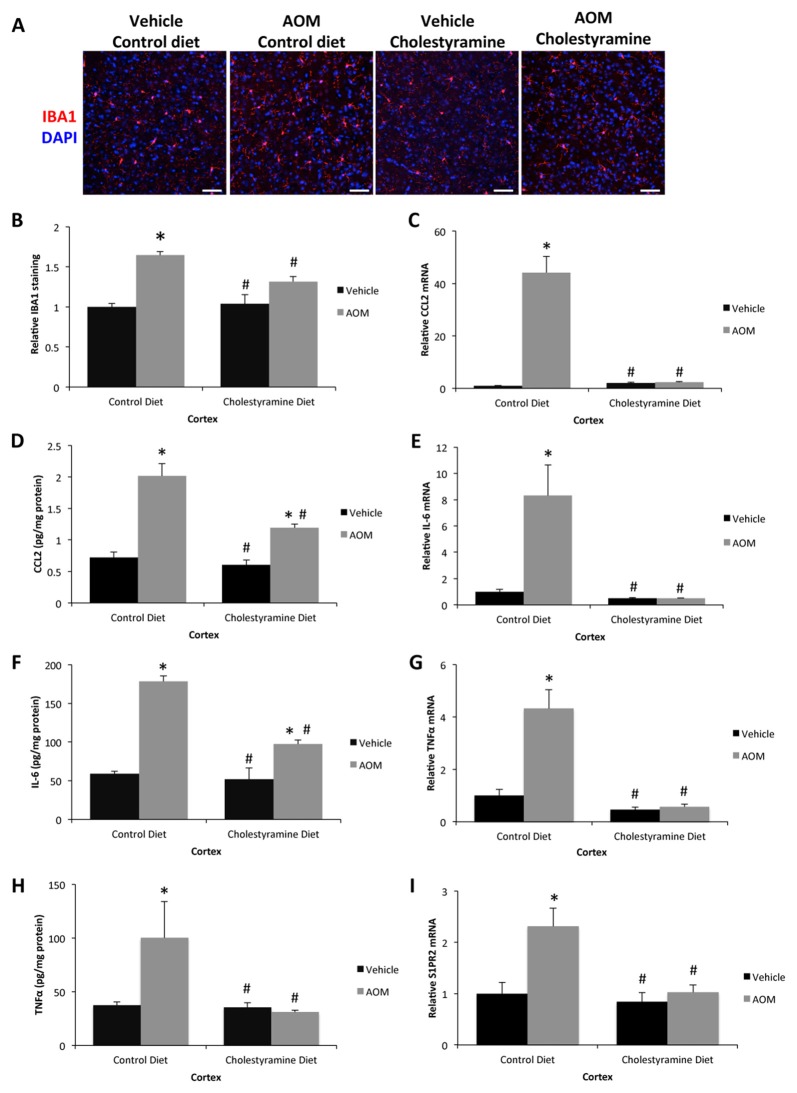
Figure 3.
Neuroinflammation can be reduced by cholestyramine supplementation. (A) Representative staining for IBA1 (red) in the cortex from control diet and cholestyramine diet-fed mice administered saline (vehicle) or AOM. 4′,6-diamidino-2-phenylindole (DAPI; blue) was used to stain nuclei. The scale bar on the figure represents 50 μm. (B) Quantification of relative IBA1 field staining in the cortex from control diet and cholestyramine diet-fed mice administered vehicle or AOM. (C) Relative CCL2 mRNA expression in the cortex of control diet and cholestyramine diet-fed mice administered vehicle or AOM. (D) CCL2 concentrations in cortex homogenates normalized to total protein concentrations from control diet and cholestyramine diet-fed mice administered vehicle or AOM. (E) Relative IL-6 mRNA expression in the cortex of control diet and cholestyramine diet-fed mice administered vehicle or AOM. (F) IL-6 concentrations in cortex homogenates normalized to total protein concentrations from control diet and cholestyramine diet-fed mice administered vehicle or AOM. (G) Relative TNFα mRNA expression in the cortex of control diet and cholestyramine diet-fed mice administered vehicle or AOM. (H) TNFα concentrations in cortex homogenates normalized to total protein concentrations from control diet and cholestyramine diet-fed mice administered vehicle or AOM. (I) Relative cortex sphingosine-1-phosphate receptor 2 (S1PR2) mRNA expression in control diet and cholestyramine diet-fed mice administered vehicle or AOM. *p < 0.05 compared to control diet vehicle-treated mice, #p < 0.05 compared to control diet AOM-treated mice. n = 3 or greater for all analyses.

