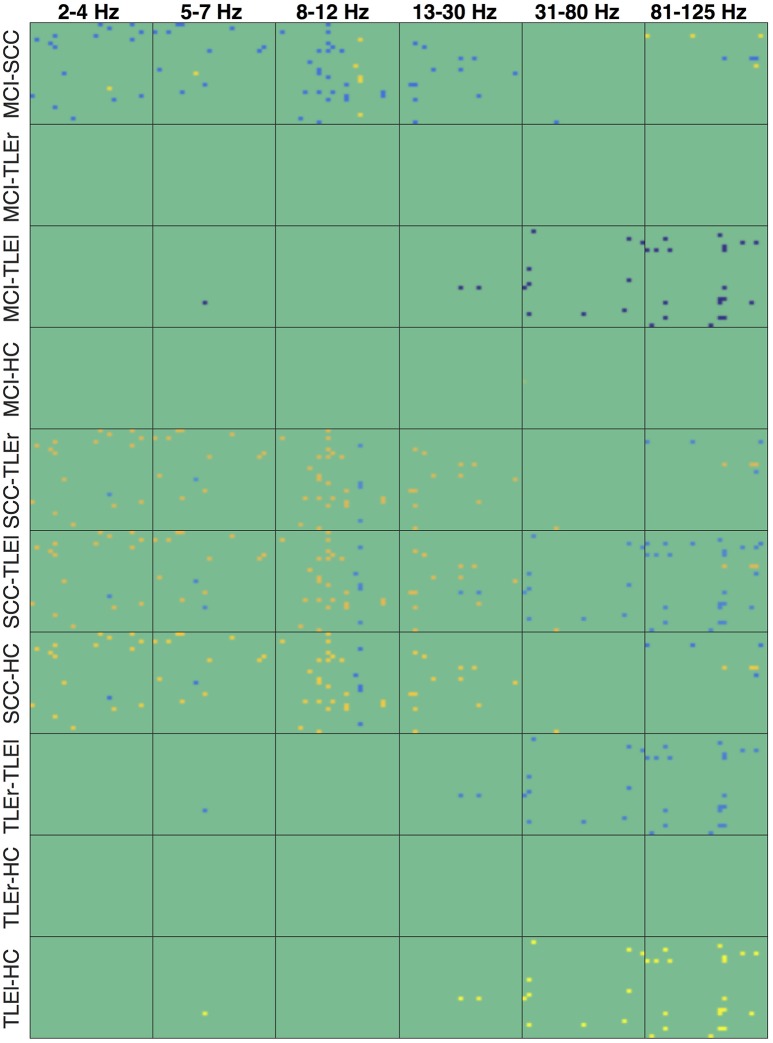
Figure 9.
Heatmaps of the group differences in reliability for full frequency directed transfer function. Heatmaps show the reliability of all electrode × electrode interactions for measure of interaction full frequency directed transfer function, sorted by group comparisons in rows and frequency in columns. Each of the small boxes is drawn as the network matrix with one point corresponding to a specific electrode × electrode combination. Colors indicate values from −37.45 (dark blue) to +32.85 (bright yellow). Not-significant differences were set to 0 and appear in green. Electrodes start from top left following the order of the list as given in Section 2.4. MCI, mild cognitive impairment; SCC, subjective cognitive complaints; TLEr, right lateralized temporal lobe epilepsy; TLEl, left lateralized temporal lobe epilepsy; HC, healthy controls.

