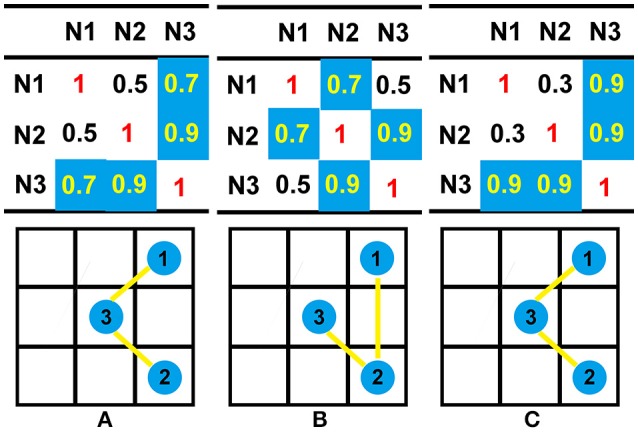
Figure 2.

Illustrations of the differences between RE and HD. Here, a coherence matrix of a three-node connection is used as an example. To compare the differences in the matrices from different methods, we set a threshold of 0.55; all connections larger than the threshold are colored with blue, and the connectivity graphs are then calculated from the original coherence matrices. According to Equation (7), the RE between matrix A and B, as well as the RE between matrix A and C, share the same value (0.1172). According to Equation (9), the HD between matrix A and B is 0.4444, while the HD between matrix A and C is zero. The topographies of each matrix are shown in bottom subfigure of (A), (B), or (C); the blue circle denote the nodes, and the yellow lines denote the binary connections between two nodes.
