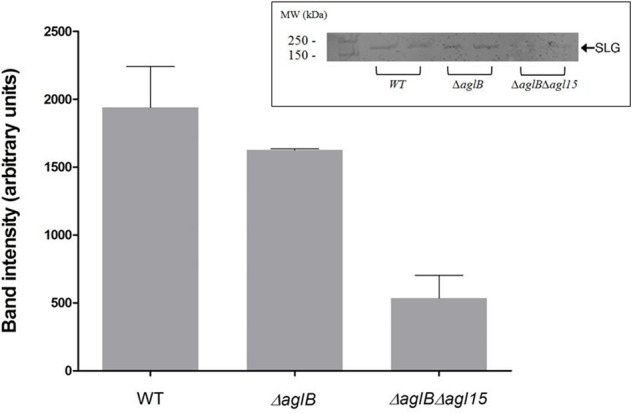
FIGURE 4.

S-layer glycoprotein glycosylation. S-layer glycoproteins from a strain with WT glycosylation, ΔaglB cells and ΔaglBΔagl15 cells (two repeats of each strain), as revealed by SDS–PAGE and staining with periodic acid-Schiff’s reagent are shown in the inset (upper right corner). The positions of molecular weight markers are shown on the left, while the position of the S-layer glycoprotein is shown on the right. Glycostained band density was analyzed using ImageJ (see Materials and Methods). The error bar represents the standard deviation.
