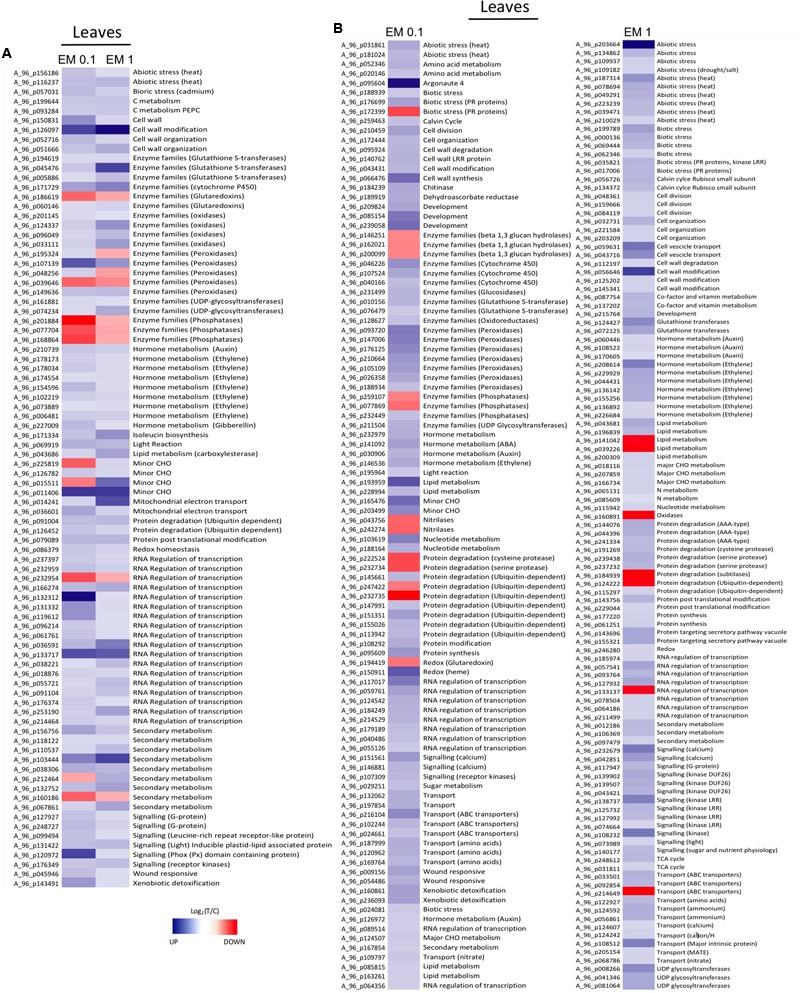
FIGURE 5.

(A) Heat Map of representative sequences differentially expressed in leaves of S. lycopersicon plants by both EM dosages (0.1 mL L-1 and EM 1 mL L-1). (B) Heat Map of representative sequences that showed differential expression in leaves of S. lycopersicon treated with a definite EM dosage. Specifically, on the left are the sequences differentially expressed only under EM 0.1 mL L-1, on the right are sequences differentially expressed only under EM 1 mL L-1. The corresponding metabolic pathways associated to the sequences are reported on the right side, while the Agilent codes are shown on the left side of each column. Different tones of blue and red indicate up-regulation and down-regulation, respectively.
