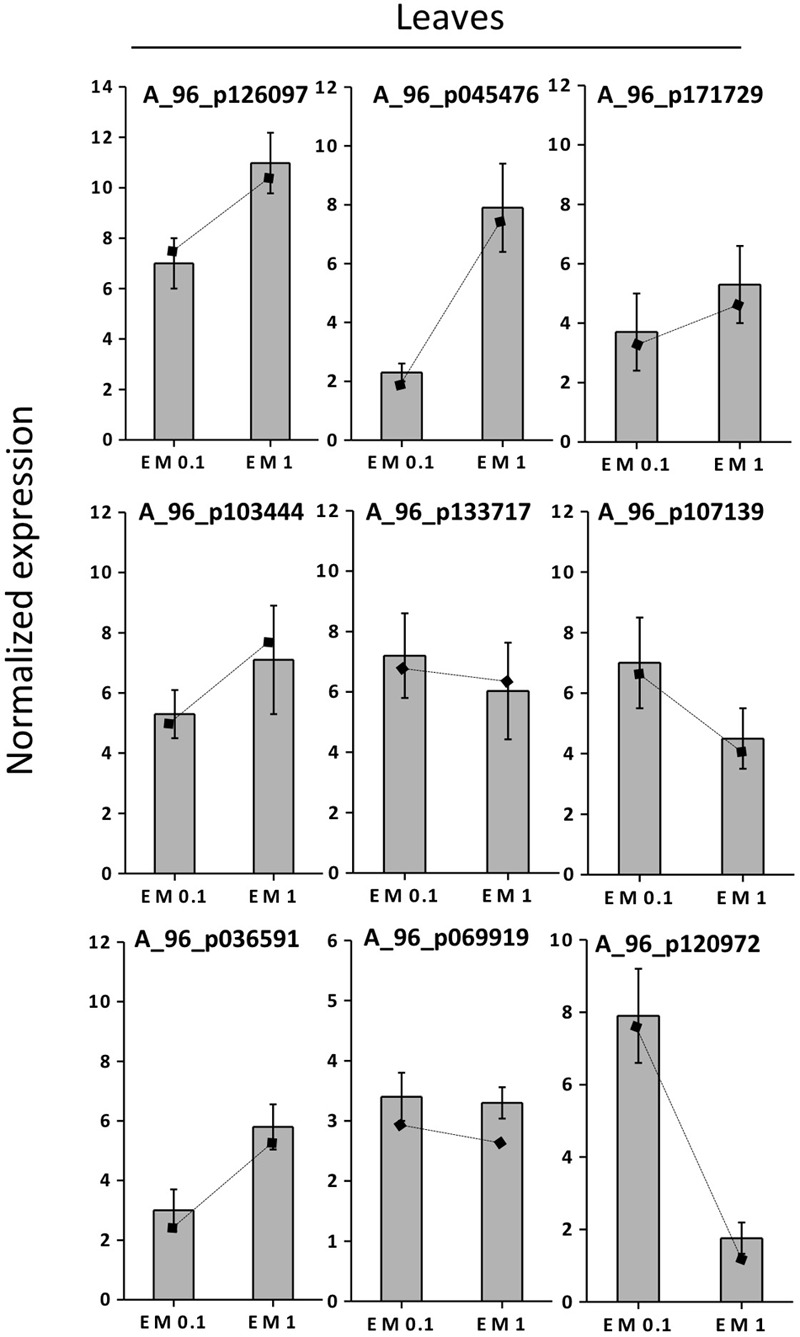
FIGURE 7.

Expression profiling by real-time RT-PCR of selected leaf EM up-regulated genes based on microarray (values are expressed as Log2 ratio of normalized intensities). Lines on bars represent values of Log2 ratio of normalized intensities from microarray data, and are reported as a comparison with qRT-PCR values. Data shown are the mean ± SD of three replicates.
