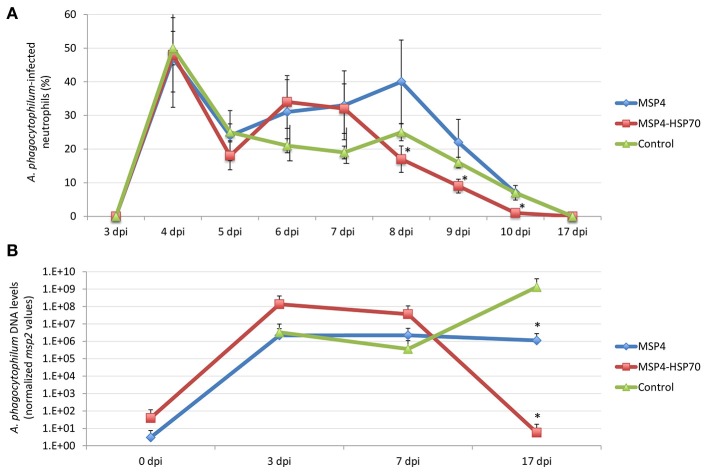
Figure 5.
Anaplasma phagocytophilum infection levels in immunized and control lambs. (A) Blood smears stained with Giemsa stain were examined to investigate the presence of A. phagocytophilum in blood cells. At least 100 neutrophils were counted and examined to calculate the number of infected neutrophils per milliliter blood of each lamb. The differential percent of A. phagocytophilum-infected neutrophils was calculated as the difference between values at different dpi and values at 3 dpi when infected neutrophils were first detected. The results were compared between immunized and control groups by two-way ANOVA test (*P < 0.05; N = 3 replicates per treatment). (B) For the quantitative analysis of A. phagocytophilum infection levels, a quatitative real-time PCR was conducted. The A. phagocytophilum DNA levels were normalized against sheep aldolase B using the genNorm method (ddCT method as implemented by Bio-Rad iQ5 Standard Edition, Version 2.0). Normalized Ct values were compared between immunized and control groups by Student's t-test with unequal variance (*P < 0.05; N = 3 replicates per treatment).

